Summary: Guava's Provider Dashboard is a HIPAA-compliant clinical dashboard that unifies lab results from 100,000+ health systems into a single longitudinal view. It normalizes units and reference ranges, aligns biomarkers using LOINC standards, supports data ingestion from EHR integrations, CCDA/XML imports, AI-powered PDF extraction, and manual entry. Clinicians can set custom reference ranges, build condition-specific biomarker panels, and view lab trends alongside wearable data from devices like Oura, Fitbit, Dexcom, and Apple Health. It's designed for concierge medicine, functional and integrative practices, and care coordination teams who need a centralized, source-agnostic view of patient lab history.
The Clinical Problem: Fragmented Lab Records
Healthcare interoperability remains one of the most persistent challenges in clinical practice. When patients see specialists, switch insurance plans, or move, their health records get scattered across incompatible platforms. This fragmentation impacts clinical decision-making and practice efficiency.
Consider a patient with pre-diabetes who had kidney function tests at three different facilities over two years. Without a unified view of their lab history, it’s hard to spot trends. Did their kidney function change gradually, or was there a sudden spike that requires intervention? When results are siloed, the answer is hard to find.
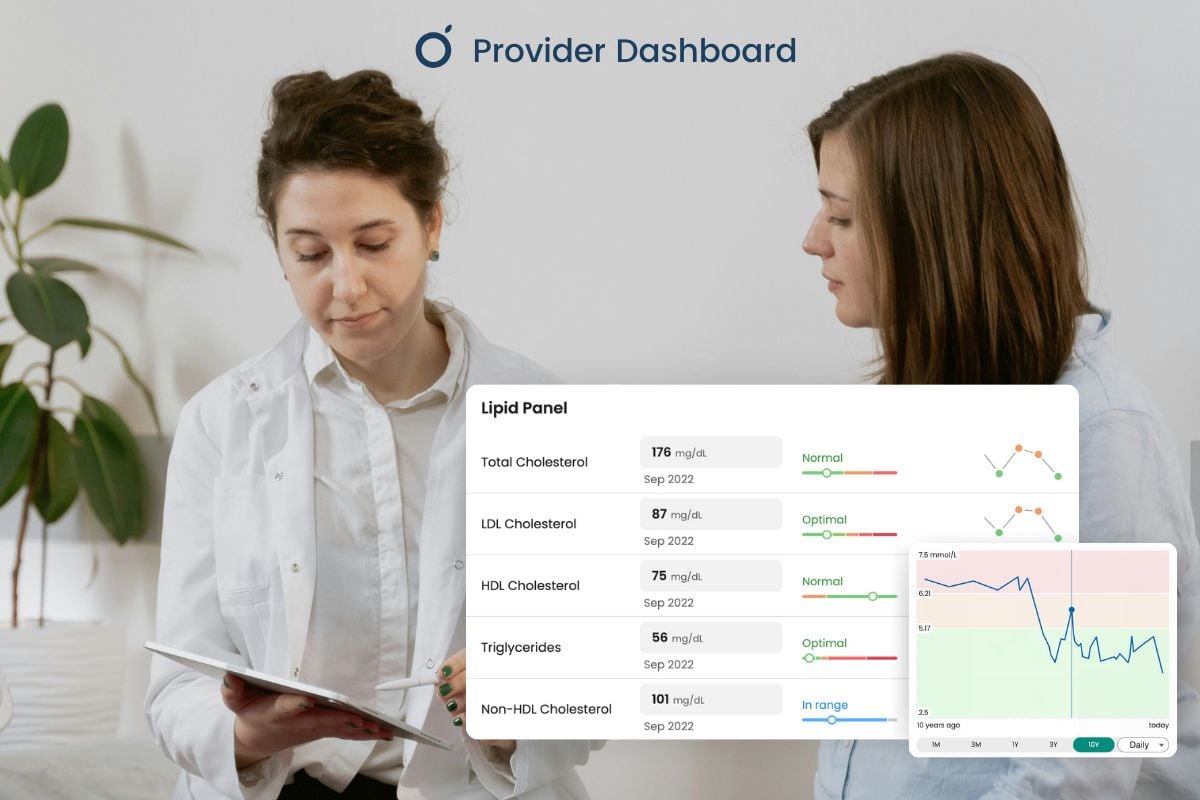
The Guava Provider Dashboard resolves these issues by creating a centralized health data hub that provides a longitudinal view of all lab data, serving as a single source of truth.
How Guava Aggregates Results From Multiple Labs
The Provider Dashboard integrates and unifies lab data from any source, giving clinicians a comprehensive picture of a patient's health regardless of where their tests were performed. Patients can connect their records through several methods:
- Direct EHR Integration: Guava integrates with over 100,000 health systems, including major patient portals like MyChart, Elation, Healow, and the VA’s health portal. When a patient syncs their portal, lab results flow automatically into their Guava profile.
- PDF Upload and AI Extraction: Patients who receive lab results as PDFs from their clinic or testing facility can upload them directly to Guava. These documents get parsed using AI to extract biomarker values, dates, and reference ranges, and convert them into structured, searchable data.
- CCDA and XML Files: For patients who request or download their medical records in standardized formats like Consolidated Clinical Document Architecture (CCDA) files, they can import these files into Guava and populate lab history without manual data entry.
- Manual Entry: In instances where automated methods are not available, both patients and providers can manually log results directly into the platform.
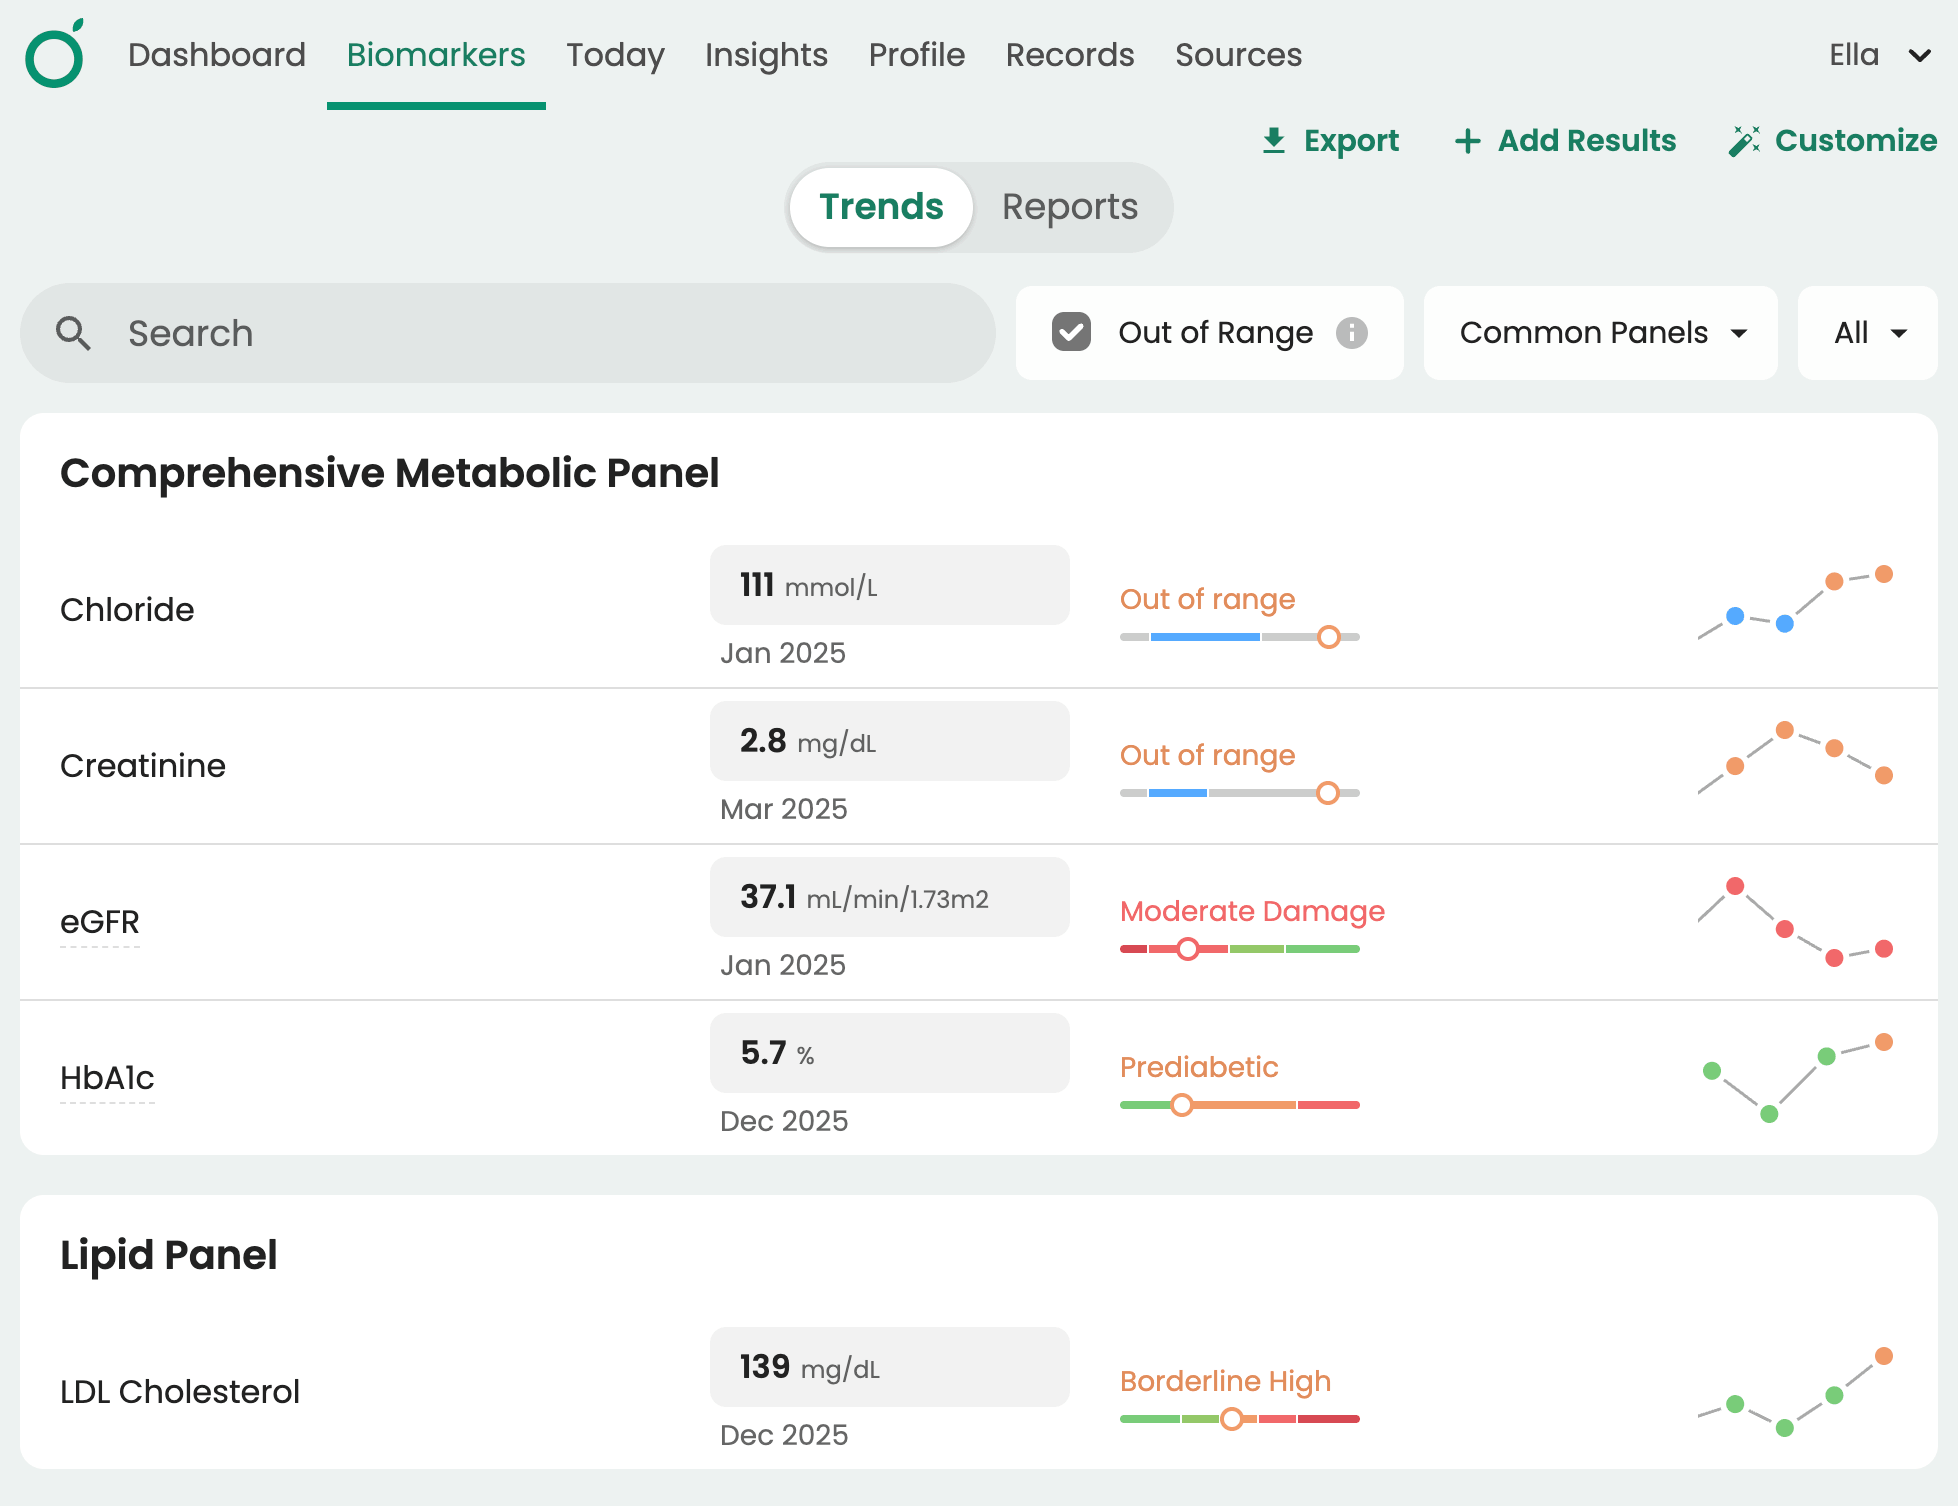
When records are added to Guava, they’re organized chronologically in the Records tab. Lab data is also extracted, normalized, and categorized by panel and body system in the Labs tab. This allows you to easily view all instances of a specific test, such as TSH or vitamin D, and compare results across different times and locations.
Learn more about AI tools for clinicians in Guava.
Lab Result Normalization: Aligning Units and Reference Ranges
One of the most powerful features of the Guava Provider Dashboard is its ability to perform data normalization on lab results. This addresses a common pain point for clinicians who review data from various labs: inconsistent units and differing reference ranges.

Unit Conversion:
Different labs may report the same biomarker using different units. Glucose, for example, is often measured in mg/dL in the United States but in mmol/L internationally. Guava automatically converts these values and their reference ranges into a consistent format, allowing you to compare results without manual calculation.
LOINC Code Alignment:
Guava uses Logical Observation Identifiers Names and Codes (LOINC), a universal standard for identifying medical laboratory observations. This ensures that "LDL cholesterol" from Quest Diagnostics is recognized as the same biomarker as "LDL-C" from LabCorp, even if the naming conventions differ.
By unifying biomarkers and their units, the Provider Dashboard consolidates diverse data points into a comprehensive clinical overview. This makes it possible to identify trends across time and across labs, rather than interpreting each result in isolation.
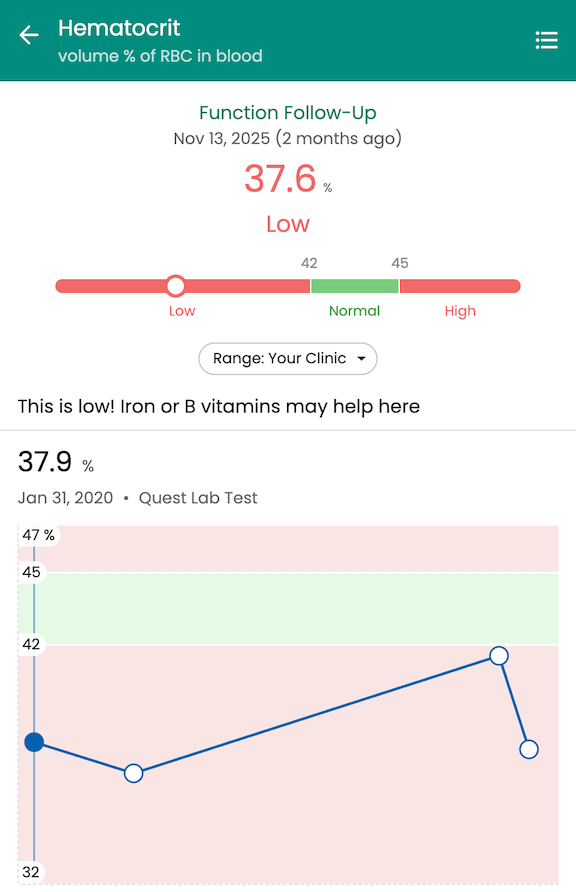
Longitudinal Biomarker Tracking for Better Clinical Insights
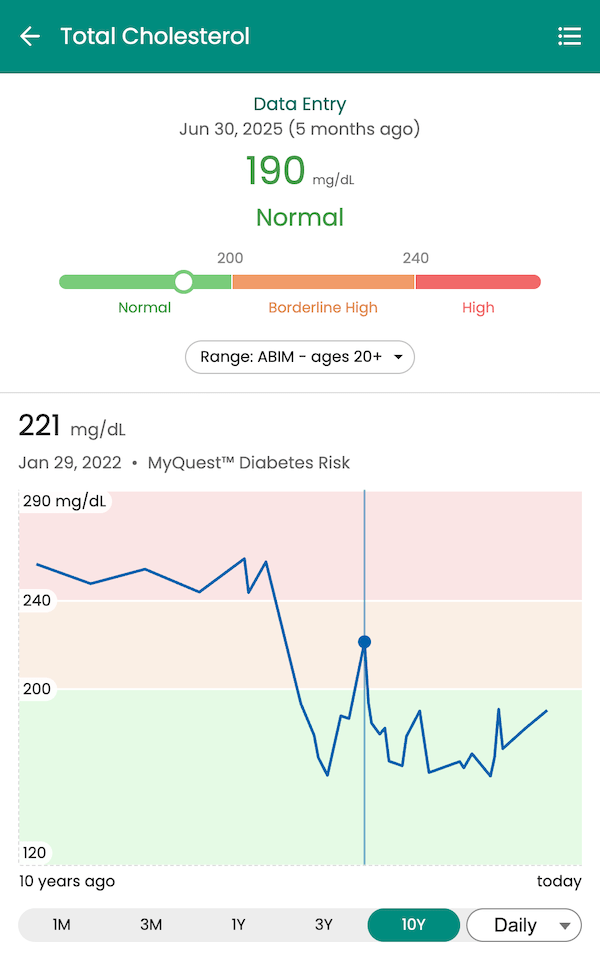
A single lab result, like a fasting glucose reading, inherently offers a limited snapshot of a patient’s health. Although it's useful in some capacity, it fails to capture the dynamic progression of their health over time. Tracking that same marker over a year reveals whether their metabolic health is improving, holding steady, or declining.
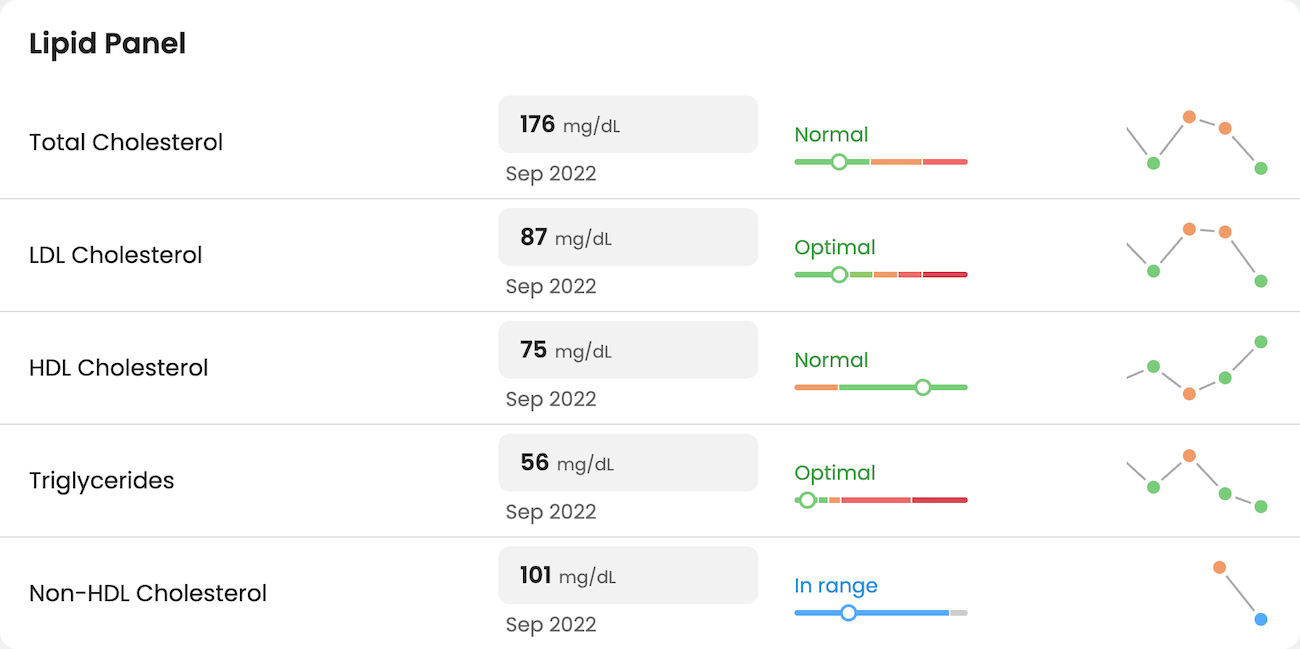
The Guava Provider Dashboard visualizes biomarker data over time through interactive charts. You can track individual markers, like hemoglobin A1c, liver enzymes, or lipid panels, and observe how they respond to interventions. Did a dietary change lower LDL cholesterol? Has thyroid medication brought TSH into its target range? These questions become easier to answer when you can see the full timeline at a glance.

- Dr. Mike Stone, Board-Certified Concierge Medicine Physician
This kind of proactive monitoring depends on having comprehensive, up-to-date information. When lab data from multiple sources is unified in one place, patterns that might otherwise go unnoticed become visible.
Custom Lab Ranges, Descriptions, and Biomarker Groups
Not every patient fits neatly into standard reference ranges, and not all lab results are equally significant between patients. A functional medicine provider might track biomarkers that fall outside conventional panels and standards, while an endocrinologist managing diabetes may want tighter glucose targets for certain patients. The Provider Dashboard accommodates this variability through customizable reference ranges.
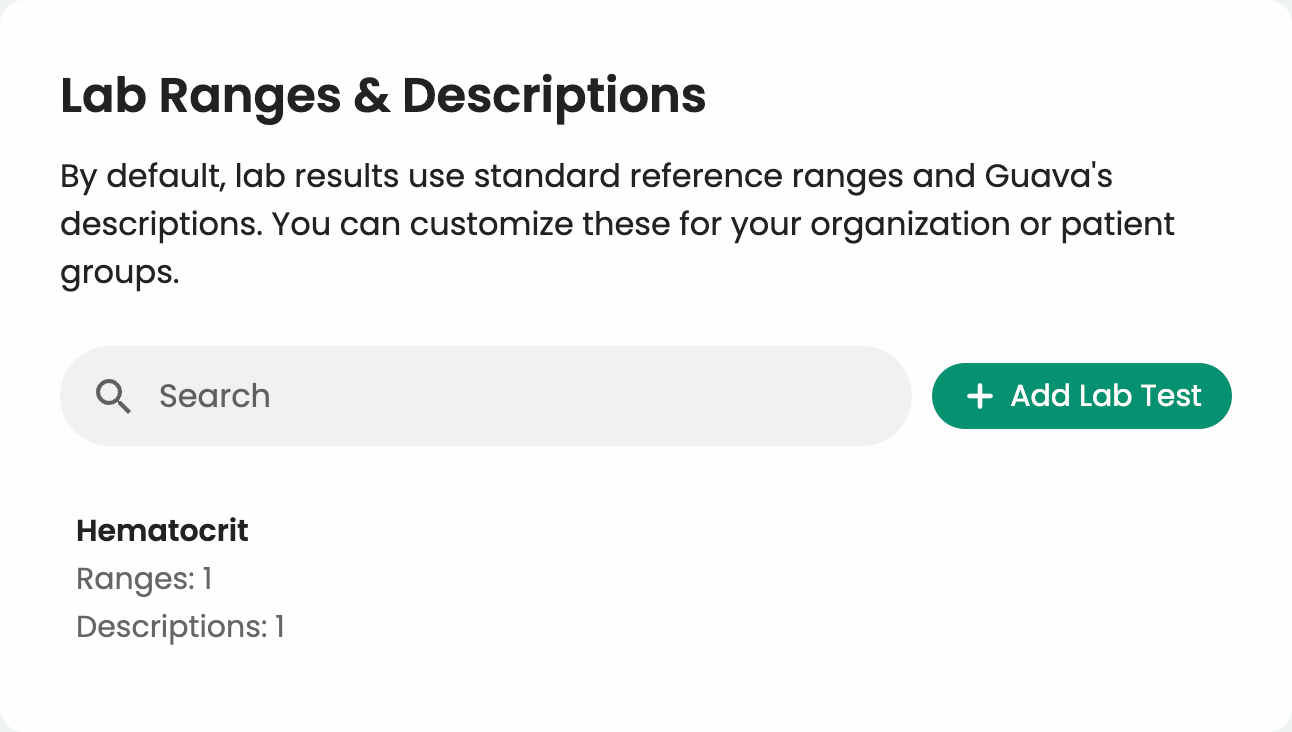
You can adjust target ranges and biomarker descriptions to reflect the unique health goals of individuals, your whole organization, or groups specified by age and sex. A prediabetic patient working to reverse insulin resistance might have a tighter HbA1c target than someone managing long-standing type 2 diabetes.
Custom descriptions allow you to explain why their targets might be different and what they can do to reach their goals. Guava lets you define these thresholds, so both you and your patient can track progress against meaningful benchmarks.
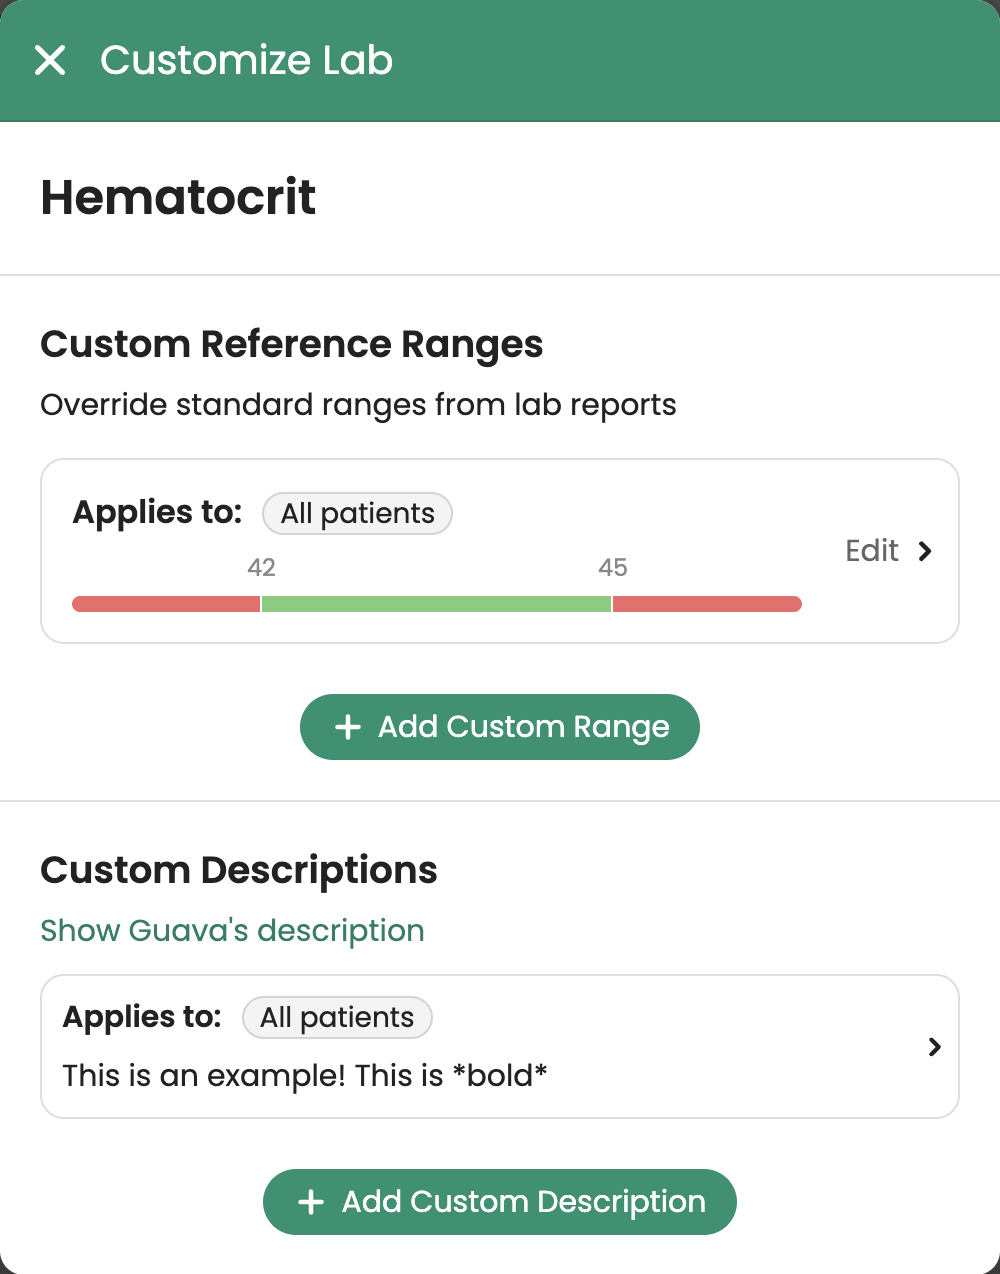
For context, Guava also displays the lab’s standardized reference ranges and provides reference ranges for common labs from trusted sources like the National Institutes of Health, Centers for Disease Control and Prevention, the American Board of Internal Medicine and the National Kidney Foundation, among others.
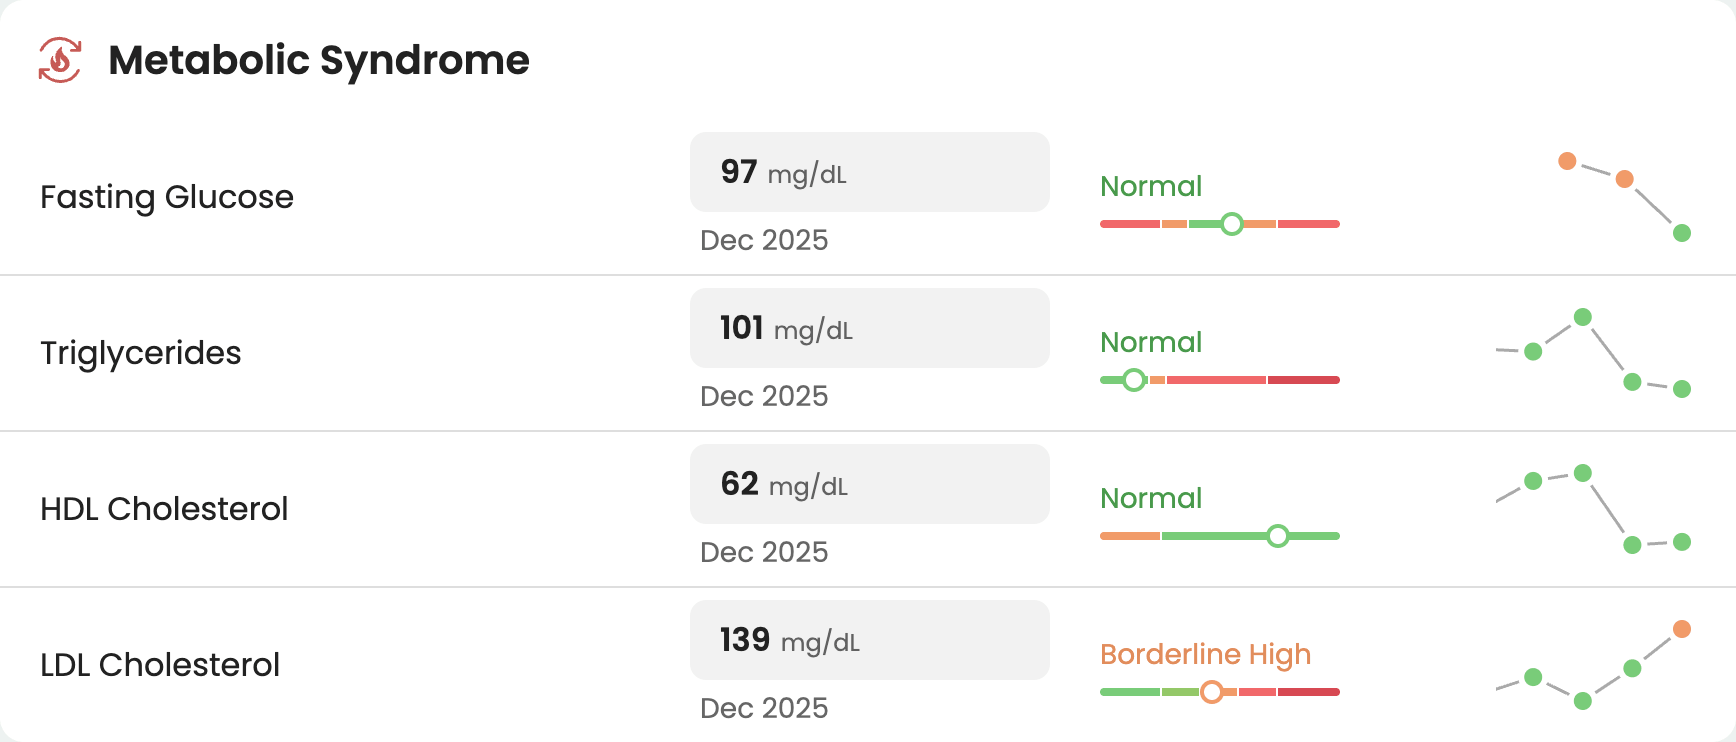
You can also create custom biomarker panels tailored to specific conditions or treatment protocols you utilize in your practice. If you frequently monitor patients for metabolic syndrome, you might build a group that includes fasting glucose, triglycerides, HDL cholesterol, and blood pressure.

When reviewing a patient's profile, you can pull up this panel in one click rather than searching for individual markers scattered across their lab history.
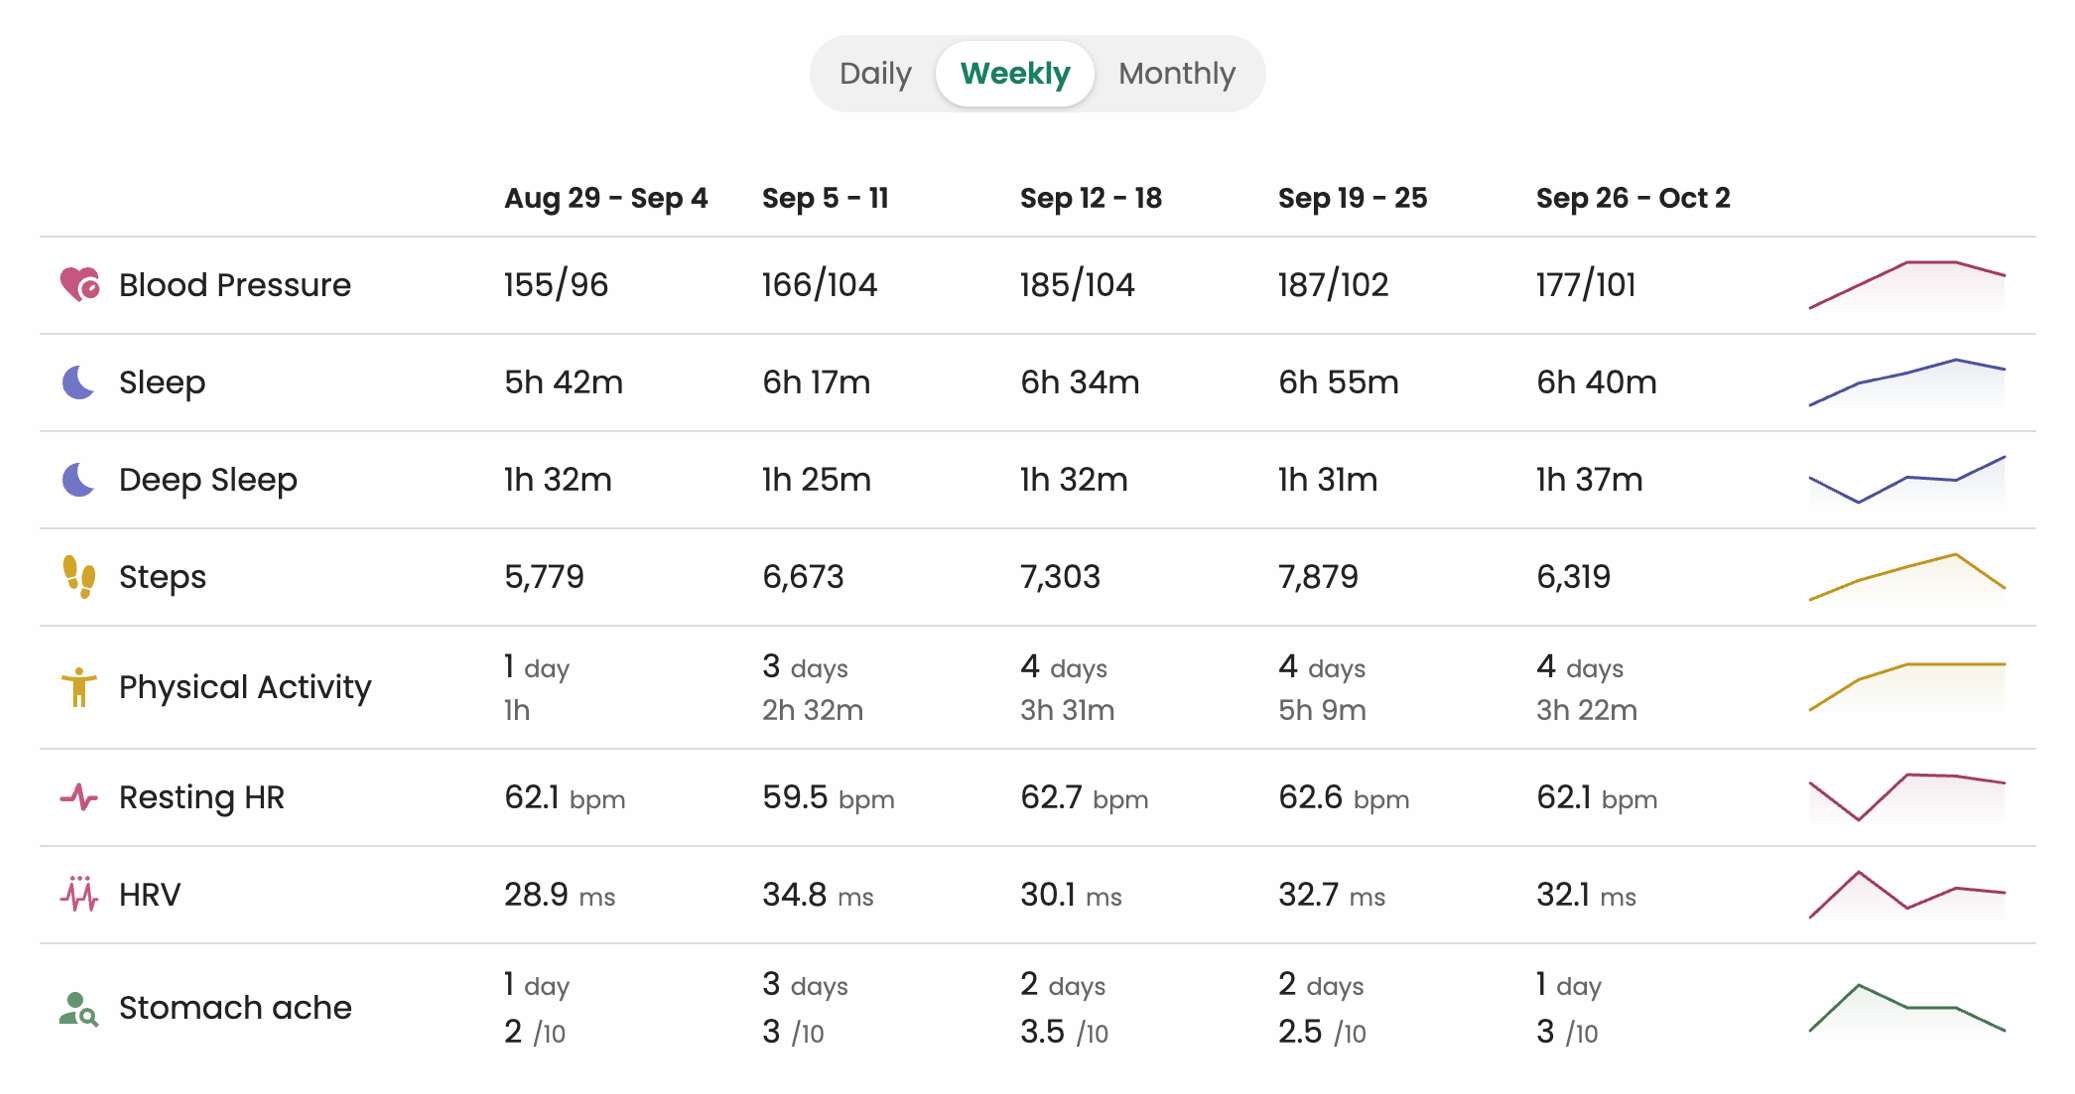
Integrating Labs with Wearables and Lifestyle Data
Lab results don't exist in a vacuum; they're influenced by a wide range of physiological and external factors. The Guava Provider Dashboard connects lab data with real-time inputs from wearables and daily health tracking, giving you a more complete picture of what is driving their results.
Learn more about Key Metrics in the Provider Dashboard.
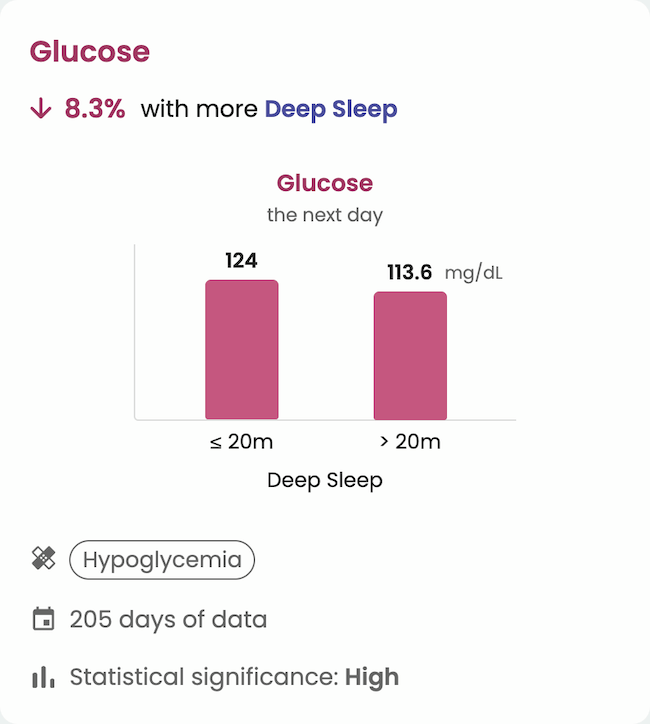
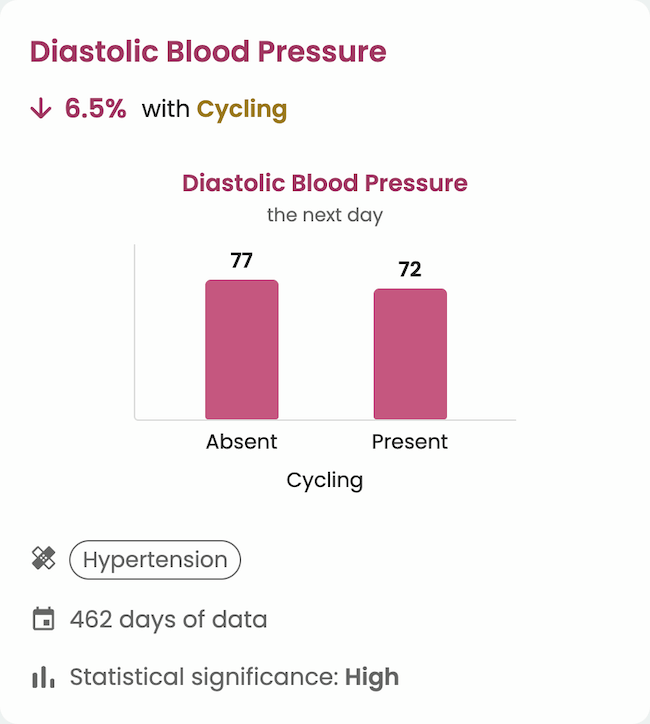
For example, a patient with elevated fasting glucose might also be logging poor sleep and high stress through the Guava app. By viewing these factors alongside their lab trends, you can identify correlations that inform your treatment approach. Perhaps their blood sugar spikes after nights with less than six hours of sleep, or their inflammation markers improve during weeks with consistent exercise. These insights help you move from reactive care to proactive, data-informed decision support.
Learn more about Insights in Guava.
The platform integrates with popular wearables like Oura, Withings, Fitbit, Dexcom, and Apple Health, as well as patient-reported data like symptoms, medications, and mood. This holistic view supports a more personalized approach to care, where interventions are guided by context that includes both lab values and your patients’ everyday lives.
Where Guava Fits in the Health Data Landscape
Clinicians working with lab data today typically rely on one of several approaches, each with trade-offs:
- EHR-native lab views (e.g., Epic, Cerner/Oracle Health) provide lab results within the system, but are limited to data generated within that health system's network. Results from outside labs, direct-to-consumer tests, or prior health systems often require manual entry or faxed records.
- Standalone patient portals (e.g., MyChart, patient-facing Quest/LabCorp portals) give patients access to their own results, but these portals are typically tied to a single lab or health system and do not aggregate data across sources.
- Health data aggregation platforms (e.g., Guava, CommonHealth, Apple Health Records) aim to pull data from multiple sources into a unified view. Guava is specifically designed for both providers and patients, offering not just aggregation but normalization, longitudinal tracking, custom reference ranges, and integration with wearable data.
What distinguishes Guava from general-purpose health record aggregators is that it combines a clinical workflow built for providers with a consumer-grade experience for patients. Clinicians can act on lab data across visits and systems, while patients can view, understand, and share their own results.
Who Benefits From a Unified Lab Data View?
The Provider Dashboard is designed for clinicians who prioritize continuity, collaboration, and patient engagement. This includes:
- Concierge and Direct Primary Care Physicians: You manage long-term relationships with patients who often see specialists or travel for care. Unifying lab data from multiple sources helps you maintain a comprehensive view without relying on external systems. Read more →
- Functional and Integrative Medicine Providers: You track biomarkers that extend beyond standard panels and work with patients on personalized protocols. Custom biomarker groups and patient-specific reference ranges support this approach. Read more →
- Care Coordination Teams: When multiple providers collaborate on a patient's care, like a primary care physician, endocrinologist, and health coach, having a shared view of lab trends improves communication and reduces redundant testing.
- Patients Seeking Ownership of Their Health Data: Beyond the clinical benefits, Guava empowers patients to consolidate and understand their own lab history. Patients already use the platform to prepare for appointments, track progress toward health goals, and share information with new providers.
Privacy and Security
Guava is fully HIPAA-compliant and takes the privacy and security of your health data seriously. All information stored in Guava is secured and encrypted using industry-standard protocols. We also safeguard data from unauthorized access and tampering by using modern cloud technologies built specifically for HIPAA compliance.
Read more about privacy and security.
Get Started With the Guava Provider Dashboard
The Guava Provider Dashboard brings results from across systems into one intuitive, longitudinal view, giving you the clarity to make informed decisions and more deliver personalized care.
Start for free and see how Guava can streamline your workflow.