The Key Metrics section gives you a concise overview of your patient’s most important health data. Quickly spot trends in areas like fatigue, sleep, heart rate variability (HRV), physical activity, and more all in one place within the Provider Dashboard. Key metrics come from your patients’ wearable devices and logged data, allowing you to see continuous, consolidated metrics over time.
You can set default key metrics for your organization to save time, and customize them for individual patients based on their needs. Multimetric charts let you compare several metrics at once over the same time period.
Customizing Key Metrics
To determine which key metrics are shown on your Dashboard, you can set clinic-wide defaults and/or customize them per patient.
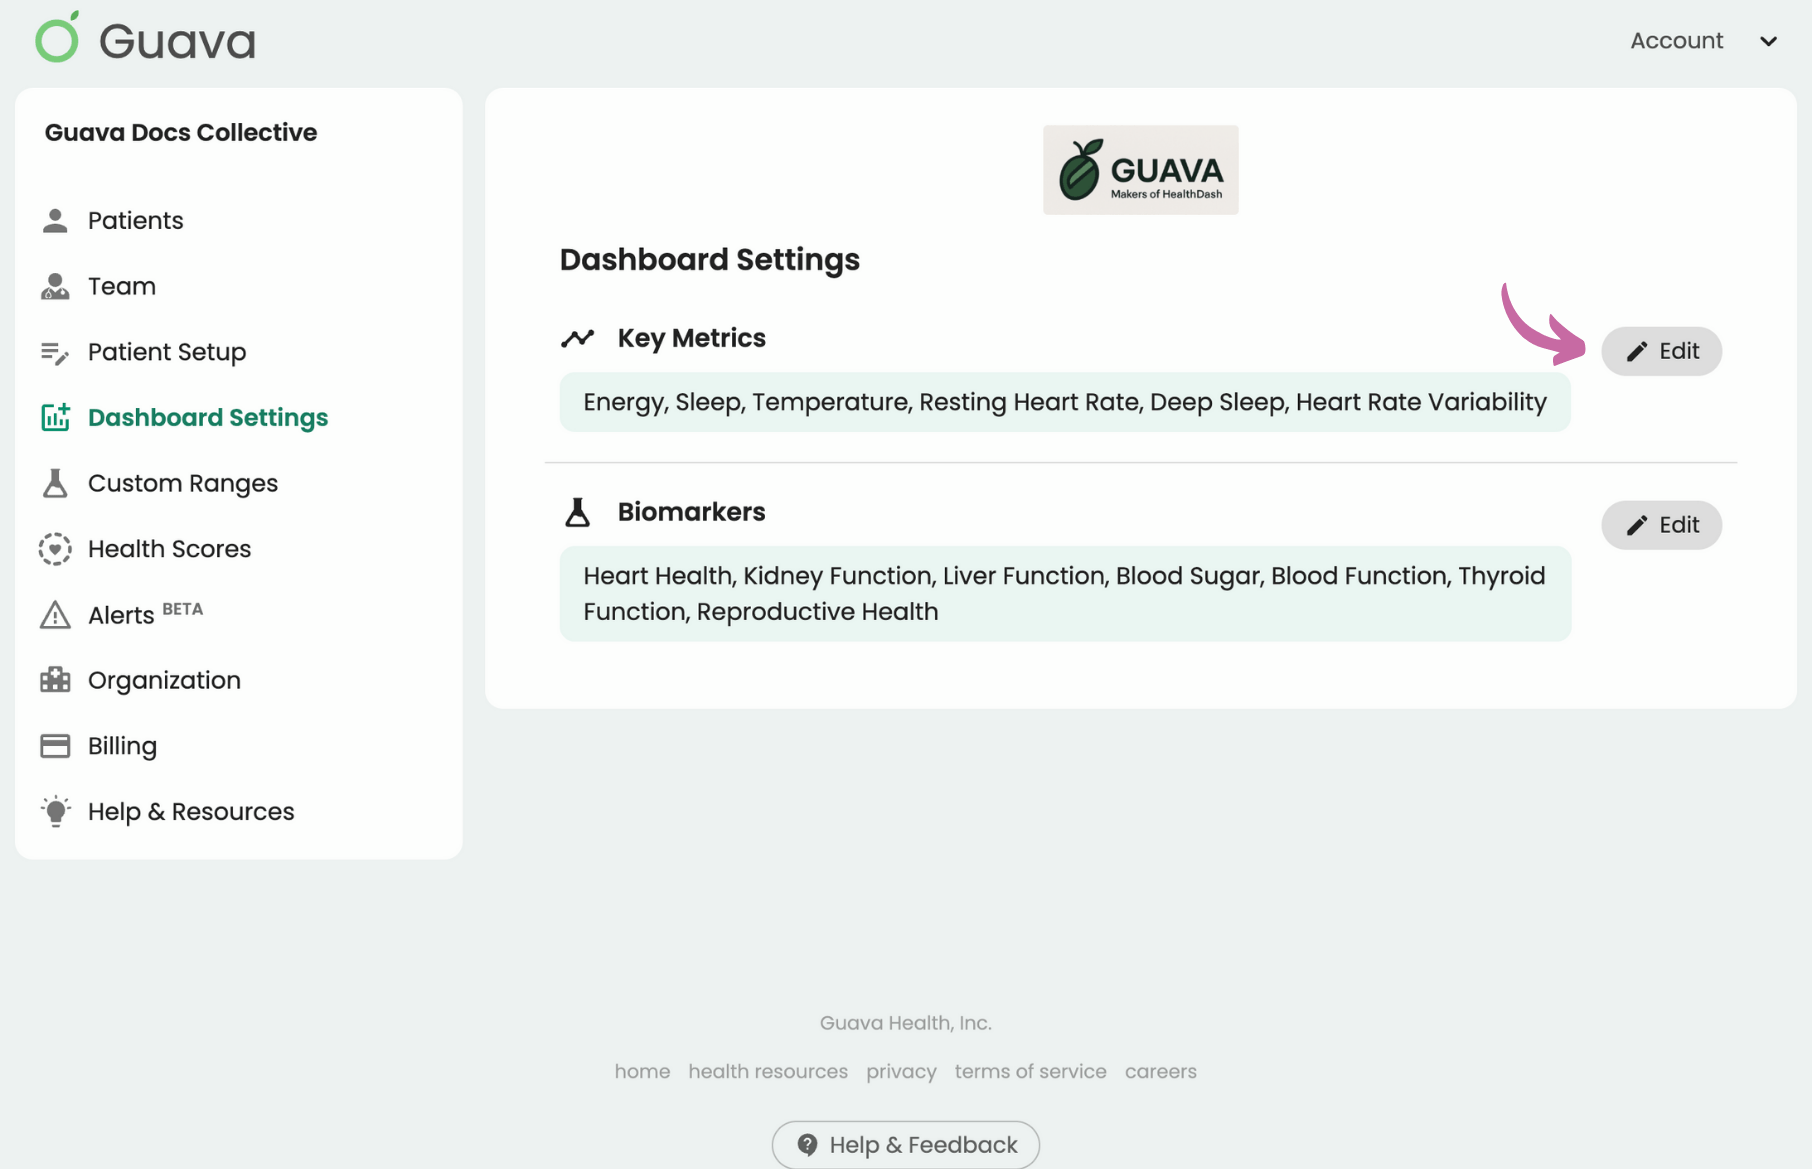
Option 1: Set clinic-wide, default Dashboard metrics for all patients at your clinic in the Dashboard Settings tab. These will only apply to newly invited patients–if you want them to apply to existing patients as well, you can press “Reset existing patients.”
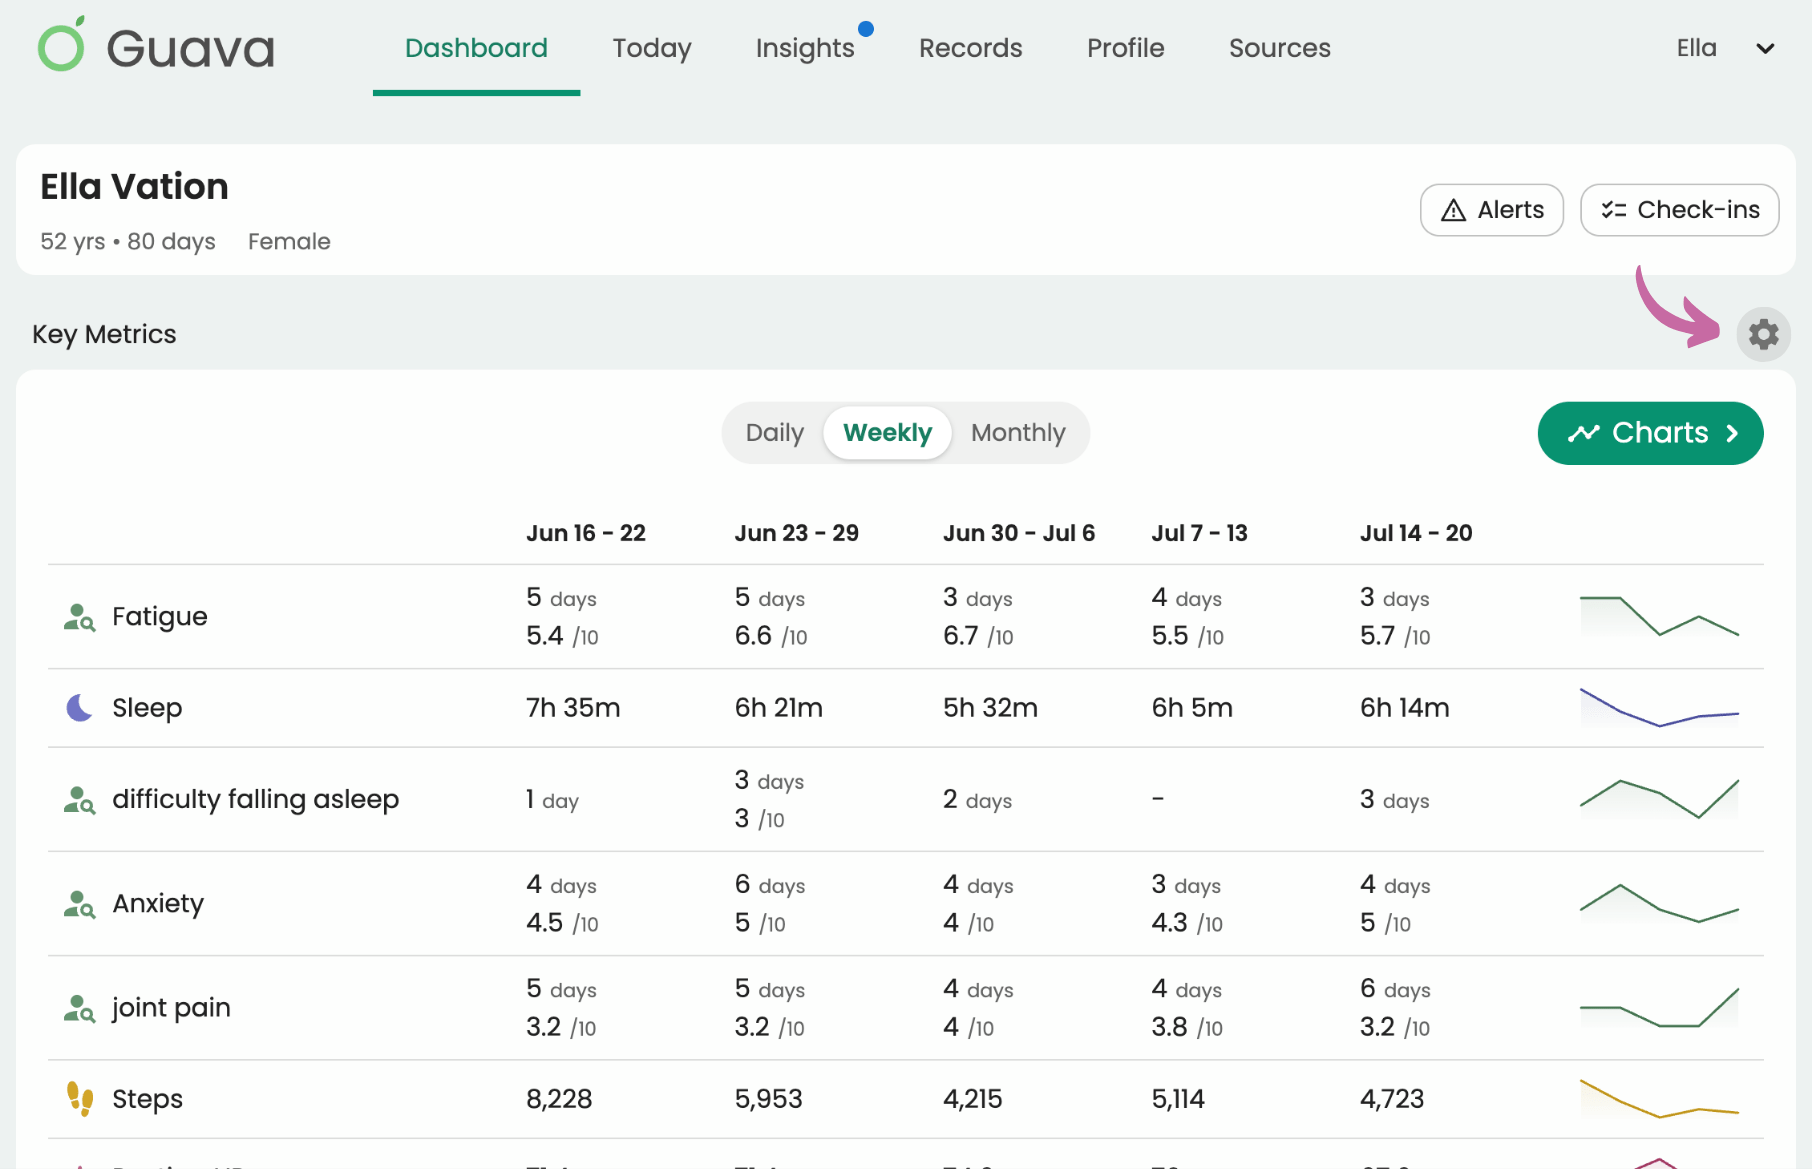
Option 2: Personalize each patient's dashboard based on their goals and health needs by selecting the gear icon in their profile.
Looking deeper into Key Metrics:
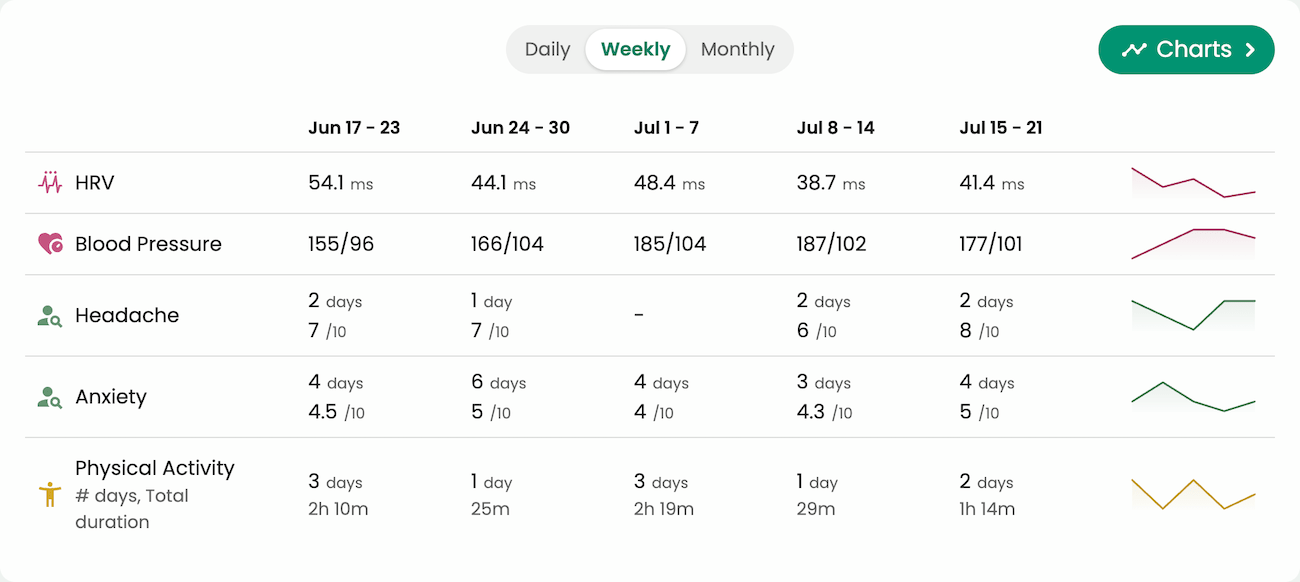
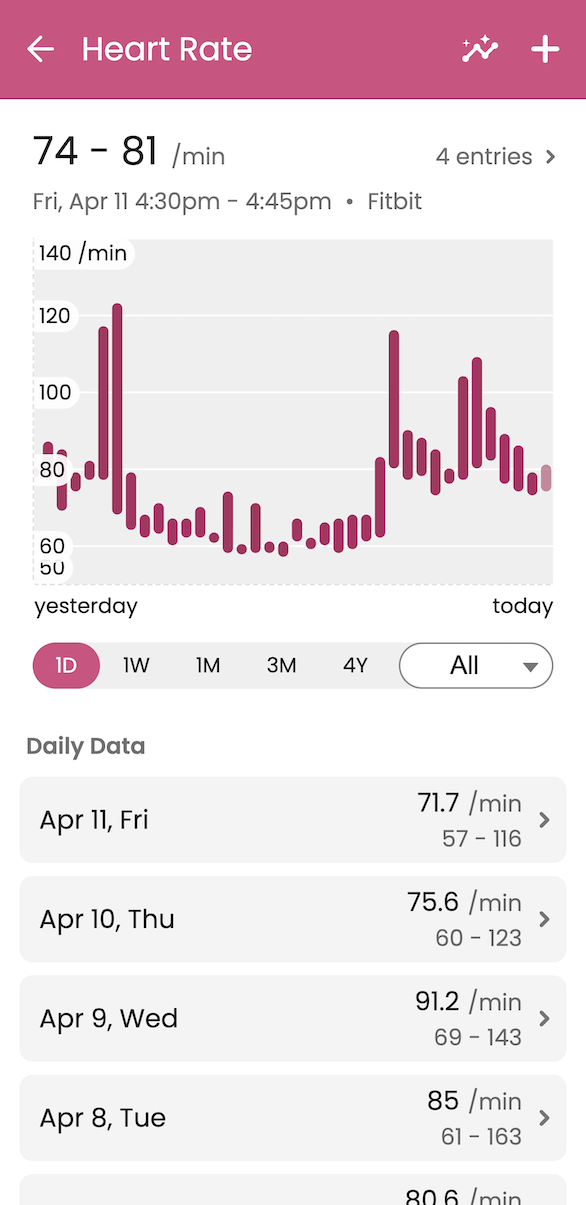
When you're looking at a patient's profile, you can click into a key metric to see more details. You’ll see different details depending on the metric. To see if they have any insights, click the graph icon in the upper right corner.

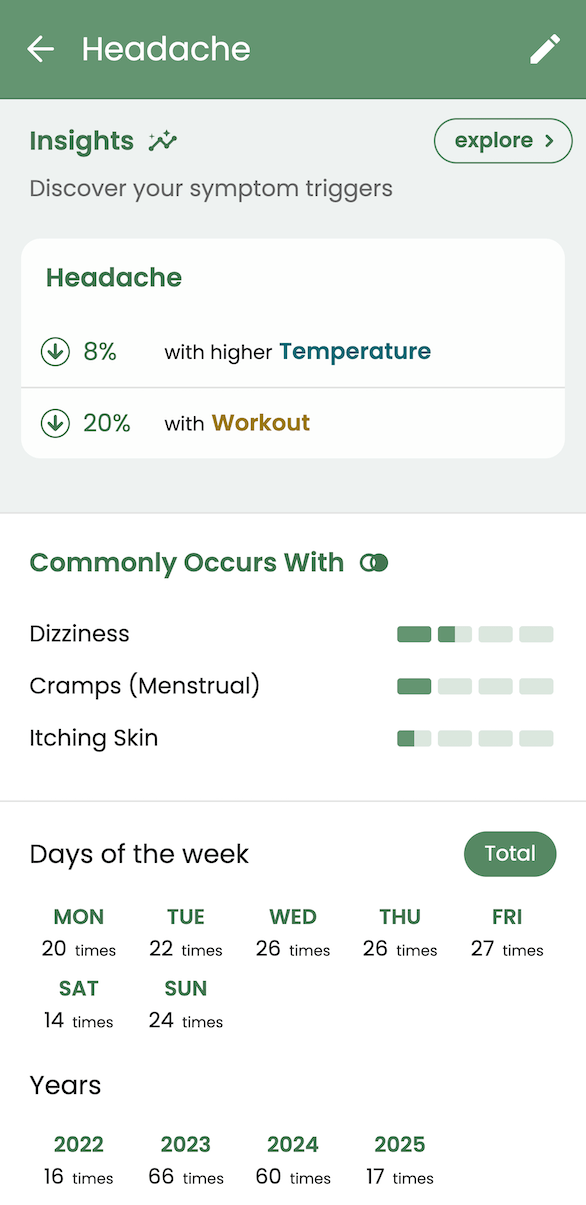
For symptoms, scroll to see trends, charts based on frequency and severity, insights, and other patterns.

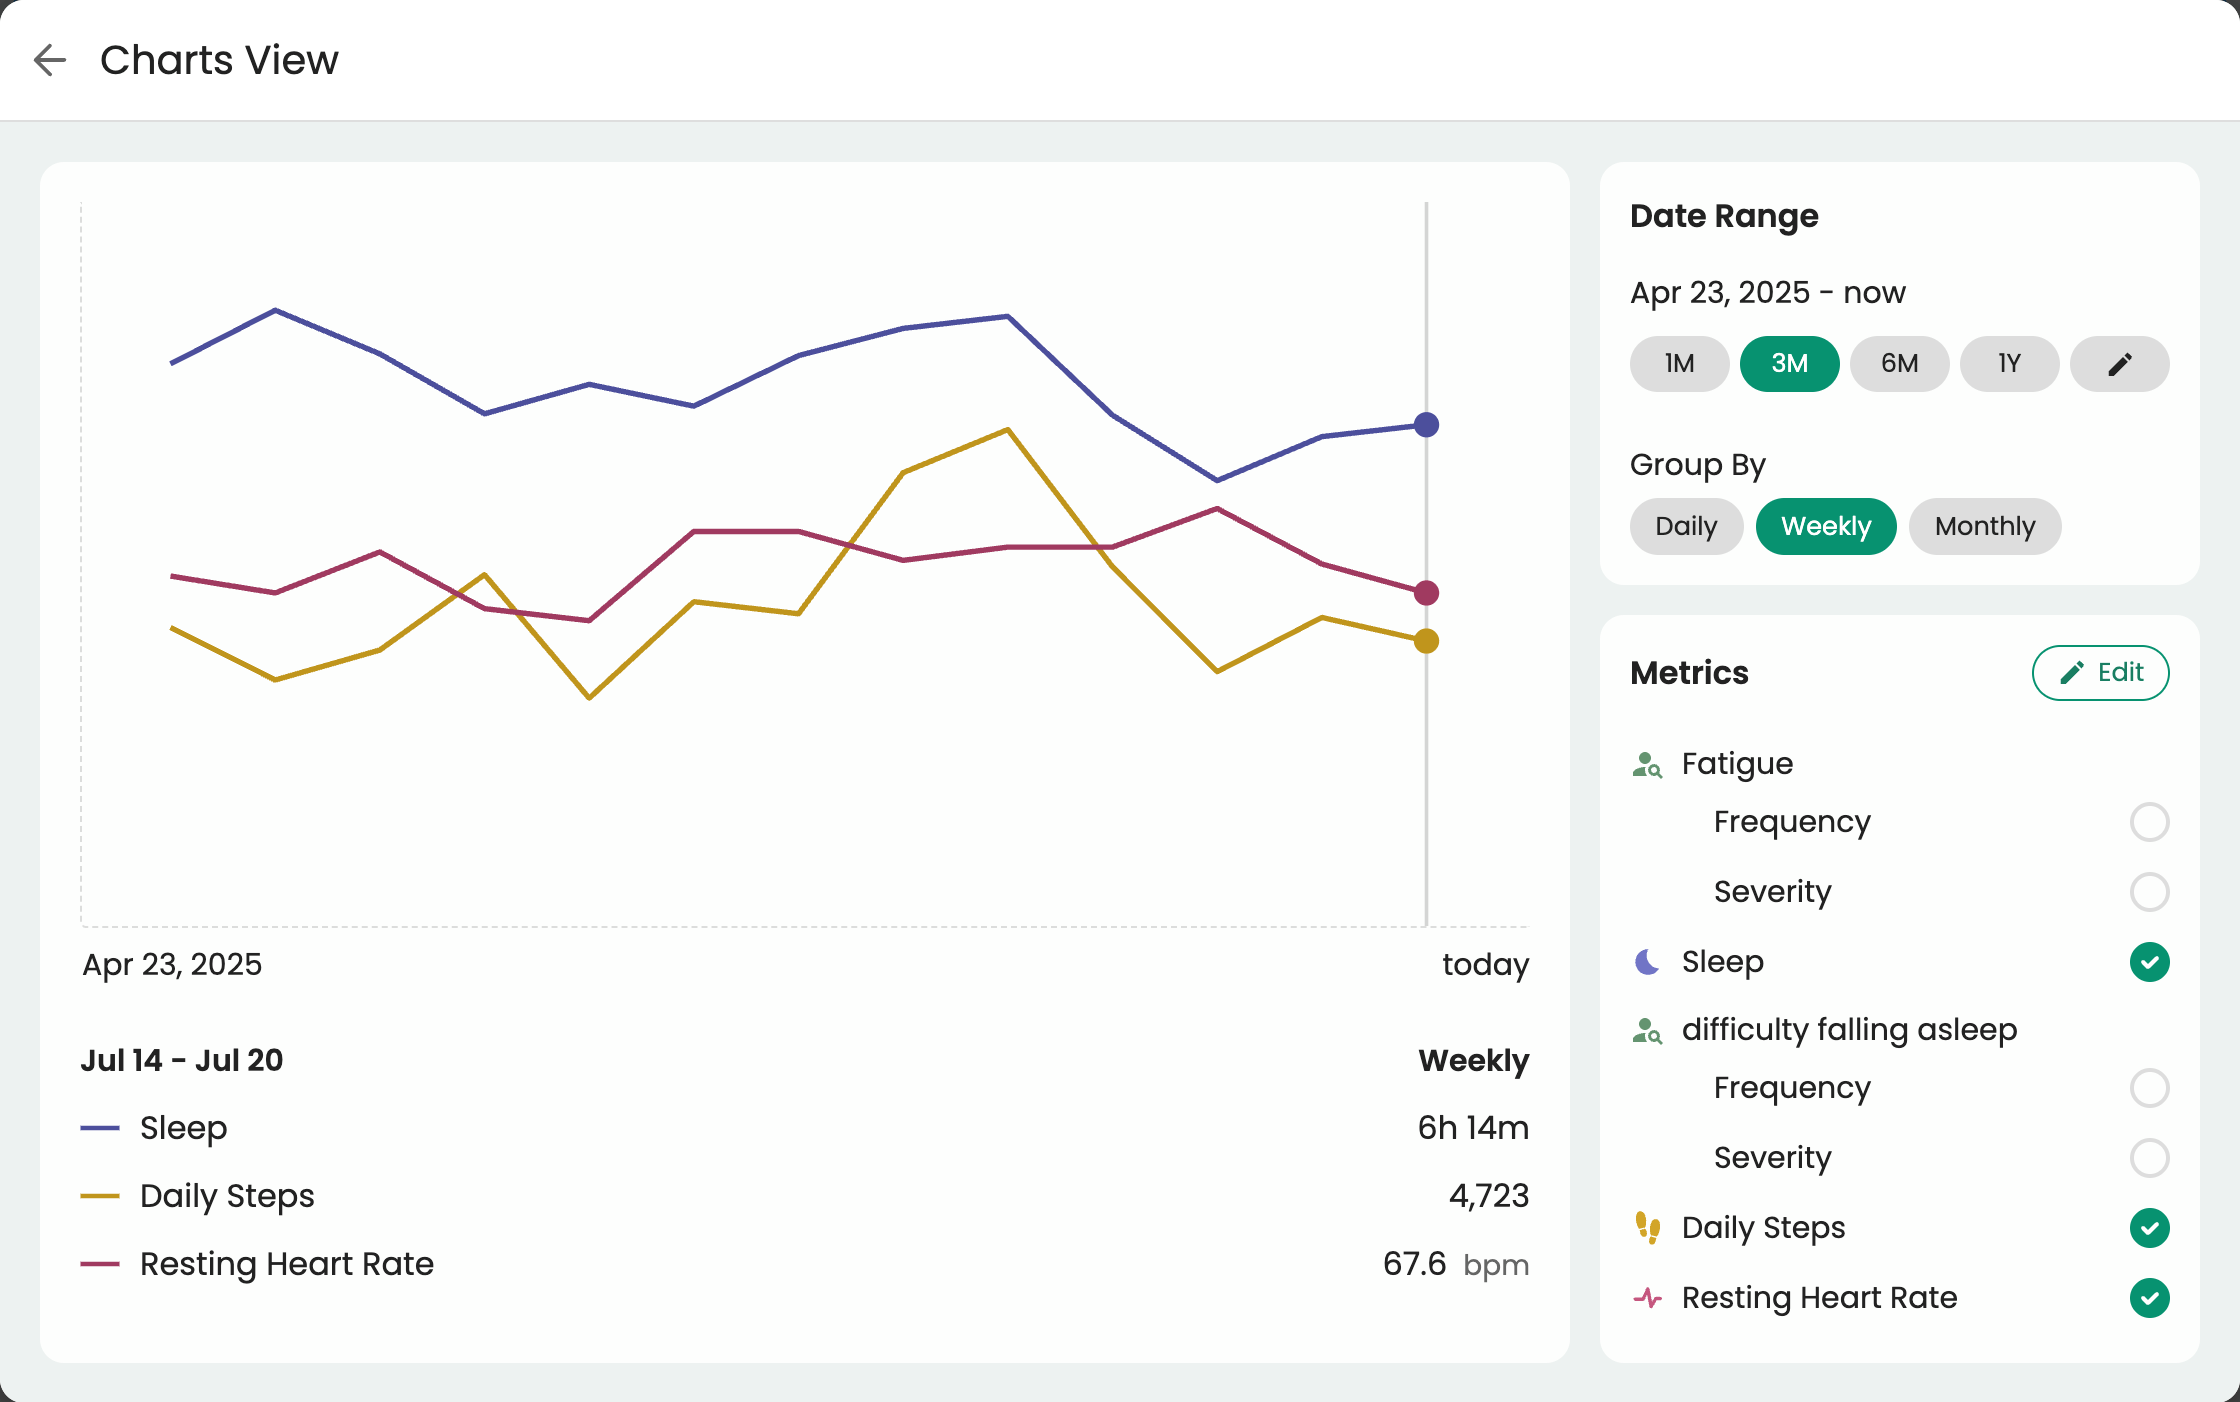
Using multimetric charts
To visually compare specific key metrics over time, select the “Charts” button in Key Metrics. Using the settings on the side, you can customize the date range, as well as which key metrics you’d like to compare.