Welcome to the Guava Provider Dashboard, a centralized hub that helps you understand your patients’ health data over time and gives your patients a user-friendly view of their health information via the Guava app. It highlights trends across symptoms, medications, wearable device data, and more. With a clearer view of what's working (and what isn’t), you can prepare for more focused, productive appointments. It reduces documentation fatigue and supports patients with complex or chronic conditions. It helps you access searchable medical records from other care settings, enable remote patient monitoring, and spot meaningful trends over time. This guide will walk you through the basics of the dashboard so you can get set up and start taking full advantage of it in your practice.
1. Getting started
To help you get oriented, we’ve set you up with a couple of demo patients whose profiles you can explore.
- Ella Vation is an example patient with symptom logs, wearable device data, medications, health records, and insights–this is information you’d see from most patients who've been using Guava for a while.
- Blanca Slate is an example patient who doesn’t have any data in Guava yet. You can use this profile to test out uploading documents and adding data entries.
These profiles are here so you can explore Guava before adding real patients. When you're ready, adding patients is easy. For now, we'll walk you through checking in on patients, preparing for visits, and building the kind of routine that makes Guava work for your practice.
Jump to how to invite patients →
2. Checking for Patient Updates
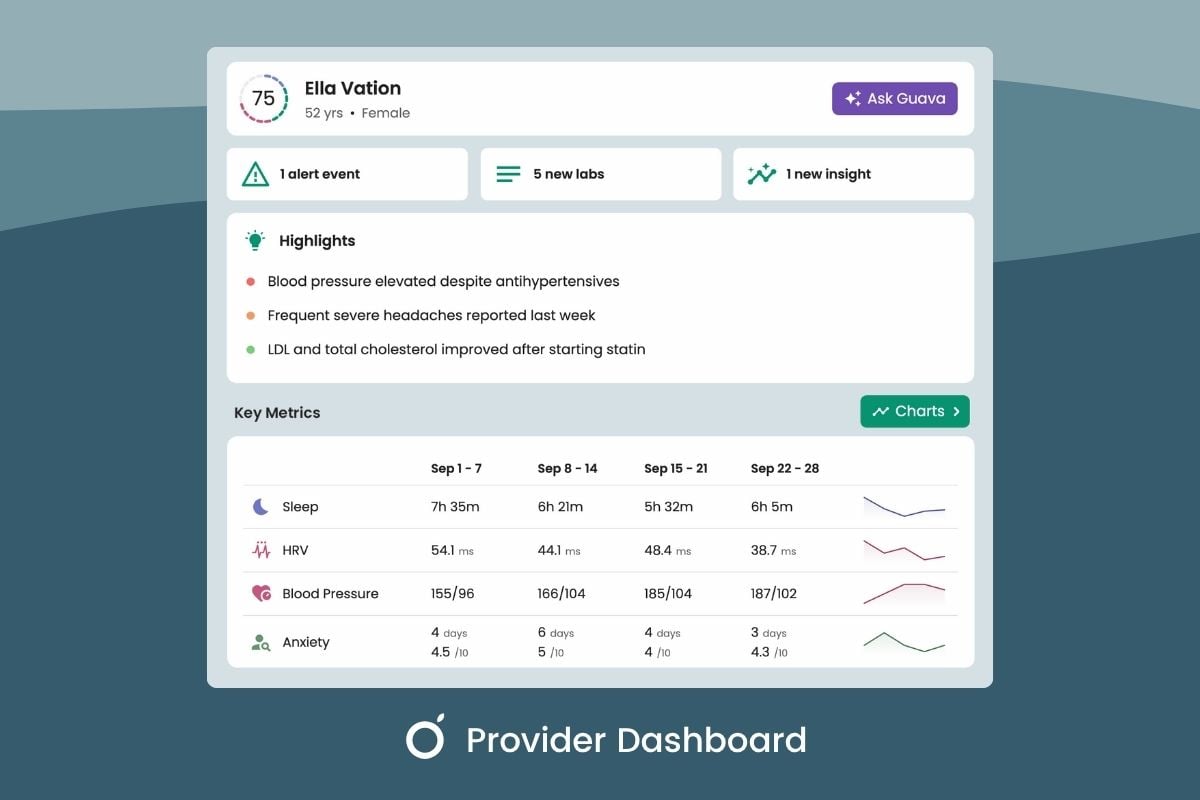
The Dashboard tab is your starting point for any patient, giving you a quick overview of what matters most before you dig into the details.
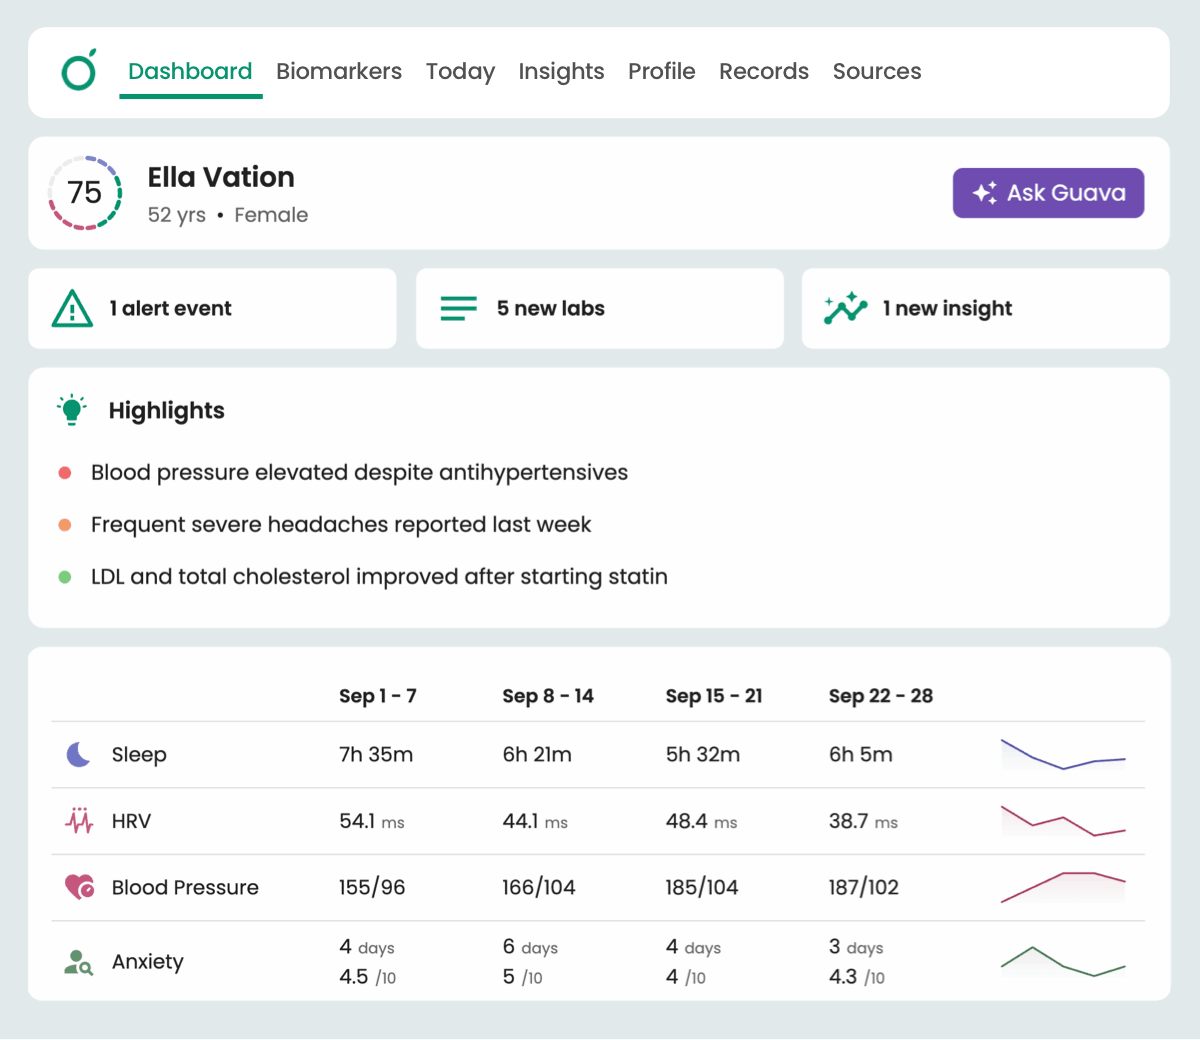
At the top, you'll notice buttons for Alerts, Records, and Insights. We'll cover each of those shortly, but the best place to start getting a feel for a patient is the Highlights section, which gives you an AI-generated summary of what's most relevant. Below that, Key Metrics gives you a snapshot of their most important numbers from wearables and patient-logged data at a glance.
AI-Powered Patient Highlights
For independent and concierge practices that want to bring AI-assisted patient monitoring into their workflow without overhauling how they practice, the AI Highlights feature in Guava is a practical entry point. Auto-generated at the top of each patient's profile, AI summarizes critical information at a glance, helping you prioritize follow-ups and walk into appointments prepared.
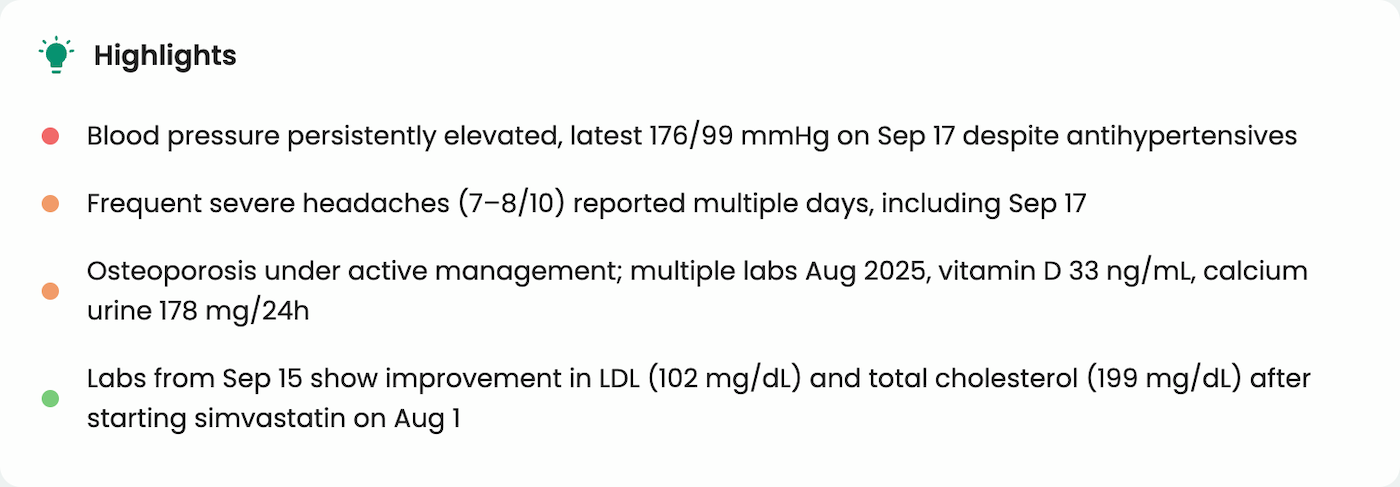
AI in Guava is secure and HIPAA-compliant; it analyzes each patient's full medical history to identify trends, recent changes, and potential concerns that warrant review, so rather than manually sifting through records, you always have an automatically updated picture of what's changed and what needs attention.
To start seeing highlights for a patient, you just need data connected and syncing. That means at least one of the following: the patient has connected their EHRs; you've set up a direct integration if your practice uses Elation, InBody, Hint, or Athena; you or the patient have uploaded records; or the patient has connected a wearable or is actively logging data in Guava.
Examples of data flagged by these AI-generated patient updates include:
- Lab Results: Notification of recent lab values that fall outside the normal range.
- Symptom Changes: Alerts for new symptoms or notable shifts in the frequency or severity of existing ones.
- Recent Encounters: Summaries of recent procedures or visit notes from your practice or other healthcare facilities.
- Vitals and Wearables: Significant changes detected in vital signs or data from connected wearable devices.
- Medications: Updates on newly added or changed dosages of medications and supplements.
Guava's AI tools also parse and organize labs, let you summarize records, and ask questions grounded in patient context. Your patients get secure AI tools too, so they can explore their own health data between visits.
Jump to Ask Guava AI section →
New Alerts, Added Records, and Insights
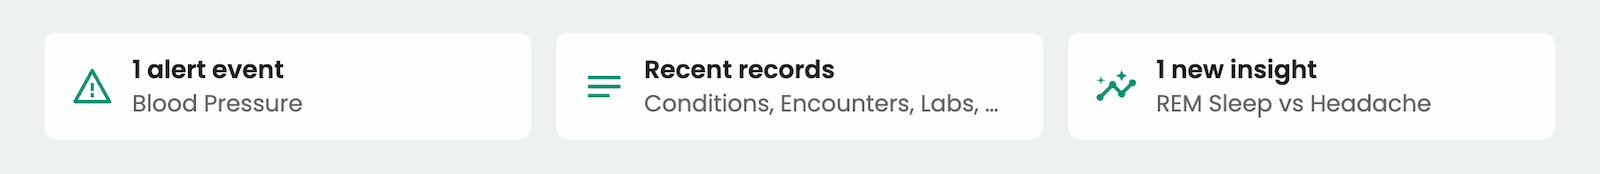
These are core features of the Guava Provider Dashboard that help you stay on top of important patient updates:
- New Alerts: Customizable notifications that flag when health metrics cross thresholds you set, ensuring you never miss critical changes. Jump to Alerts section →
- Added Records: You’ll be notified of any new health records added to your patient’s Guava profile, including synced EHR data, lab results (from you or another provider), uploaded documents, or custom entries. Click on a new record to view more details. Jump to Records section →
- Insights: Automated analyses that highlight significant patterns and correlations in your patients’ data, helping you spot trends and potential issues faster. Jump to Insights section →
Read more about how each of these works and how to configure them by jumping to their respective sections.
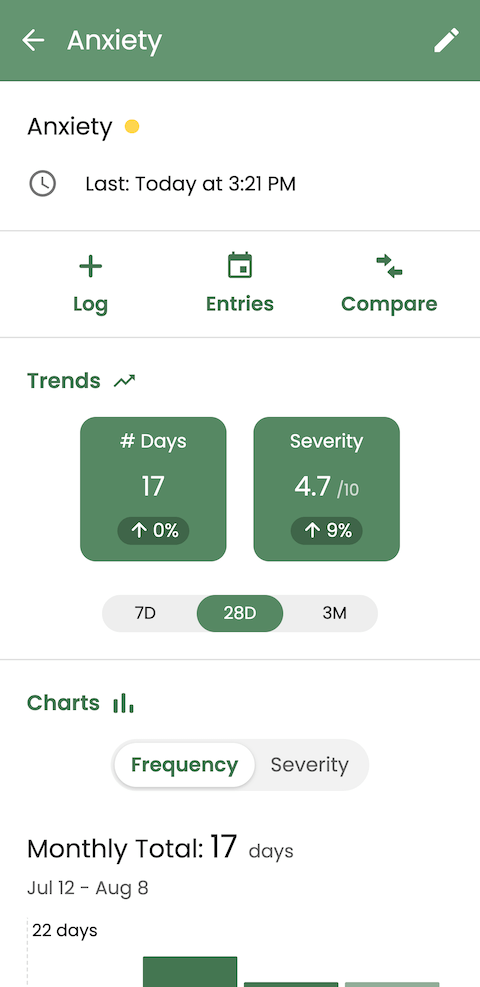
Key Metrics
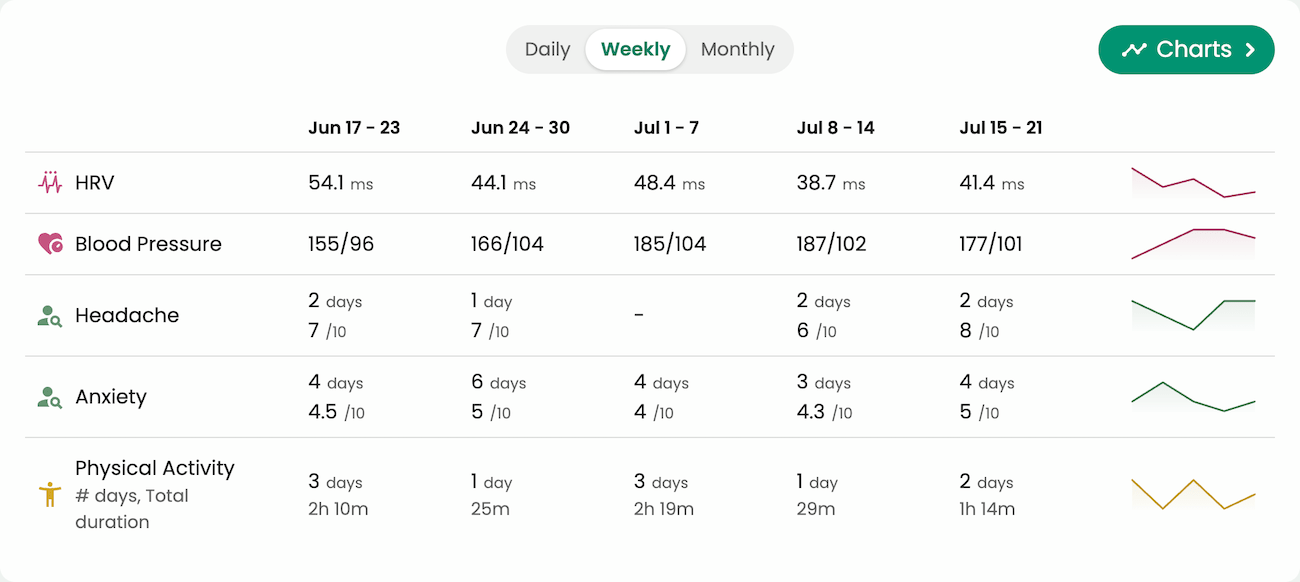
The Key Metrics section gives you a bird's-eye view of how your patient is doing across different aspects of their health–like fatigue, sleep, HRV, physical activity, and more. To see more details, click into a key metric to view trends, insights, and all-time stats. Use the Charts feature to overlay and compare key metrics over time.
Learn more about configuring Key Metrics →
3. Digging Deeper Into Patient Data
Beyond quick updates, Guava gives you the tools to dig deeper into your patients' data when you’re preparing for appointments and need a fuller picture. The Biomarkers tab, Health Scores, Records tab, and Guava AI all work together to help you analyze trends, track progress, and prepare for more meaningful visits.
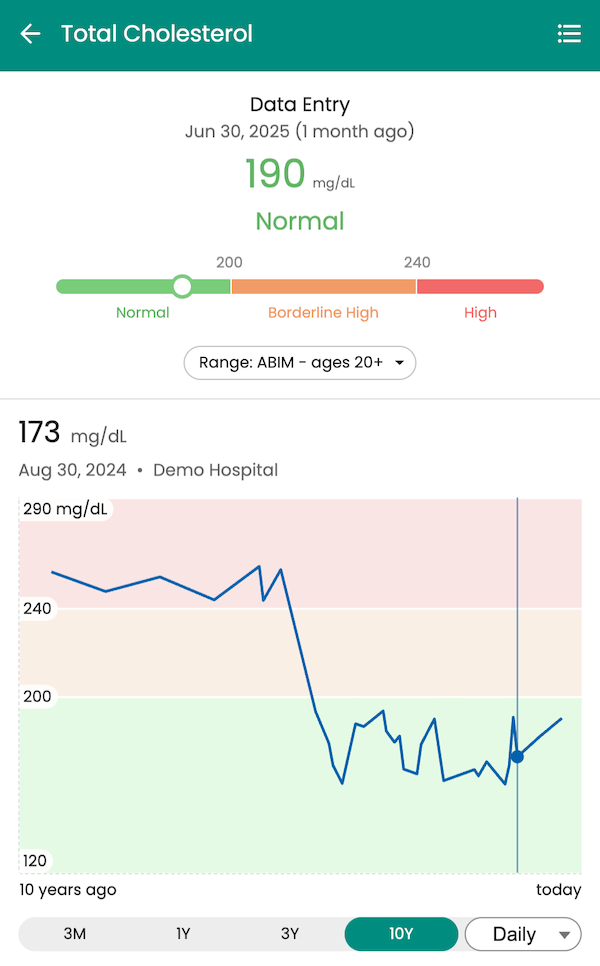
Biomarkers
The Biomarkers tab offers a unified, longitudinal view of your patients' lab results from all their EHRs and uploaded records. Lab results from any source are normalized across units, allowing for consistent visualization and more accurate clinical assessments.
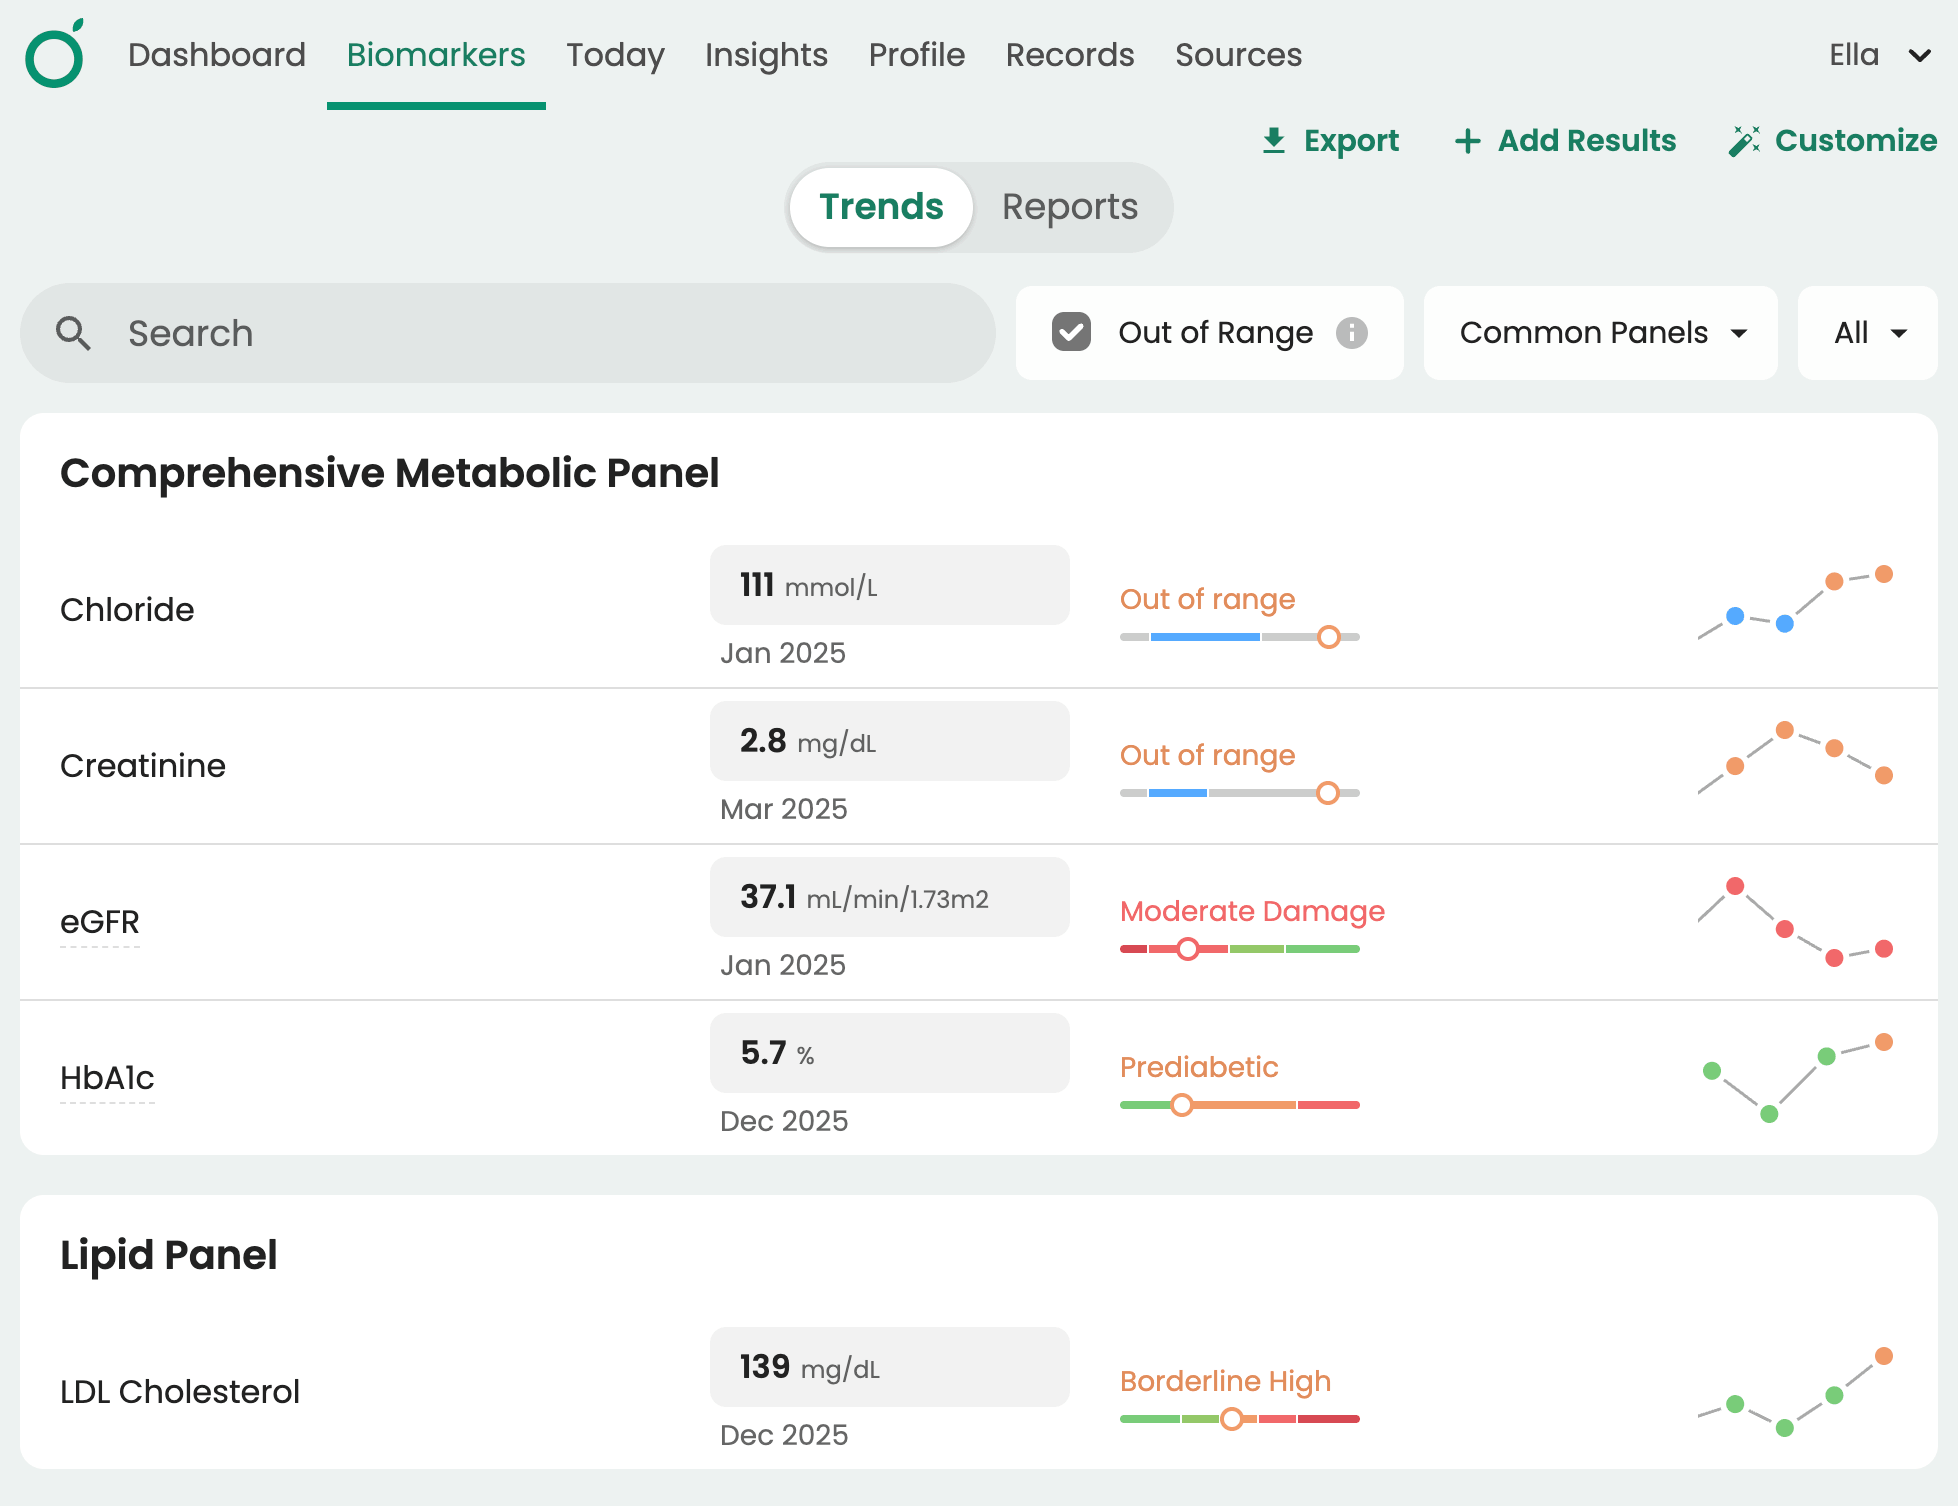
Biomarkers and labs are searchable and organized by common panels, body systems, and reports, making it easy to find what you're looking for. You also have the flexibility to set custom reference ranges, descriptions, and interpretations for individuals or patient groups.
For example, if you commonly treat patients with hypothyroidism, you might set a tighter TSH range than the standard lab reference to better reflect optimal function for that population. These customizations apply automatically whenever you're viewing those patients, so your clinical judgment is built into the experience rather than something you have to reapply manually.
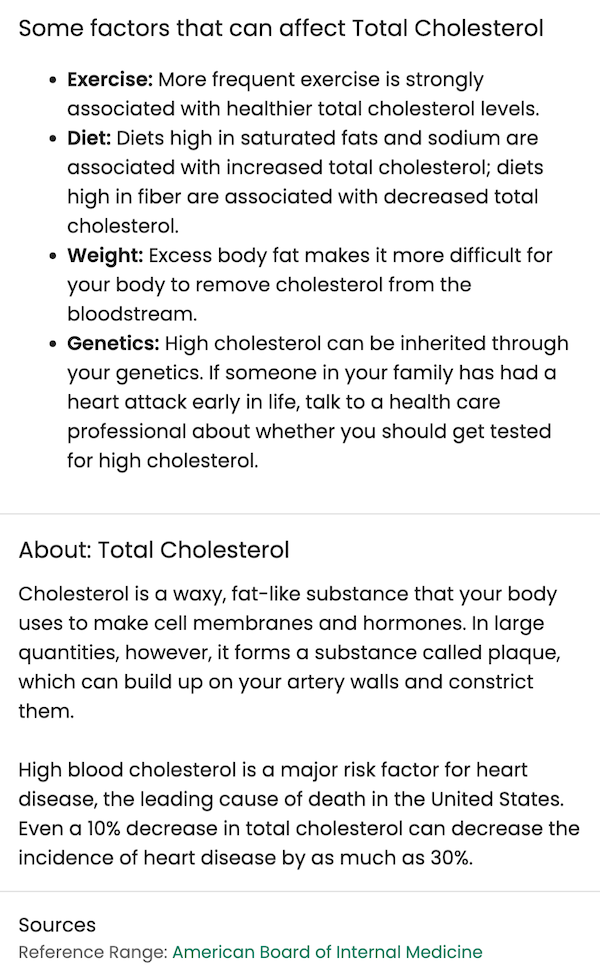
For common labs, Guava already includes standardized ranges and patient-friendly descriptions out of the box, so there's a solid baseline to work from. Patients see all of this in their own app, including any customizations their provider has made, giving them a more personalized experience and a clearer understanding of their health. Physicians can override any defaults at any time to reflect their clinical approach or a patient's individual context.
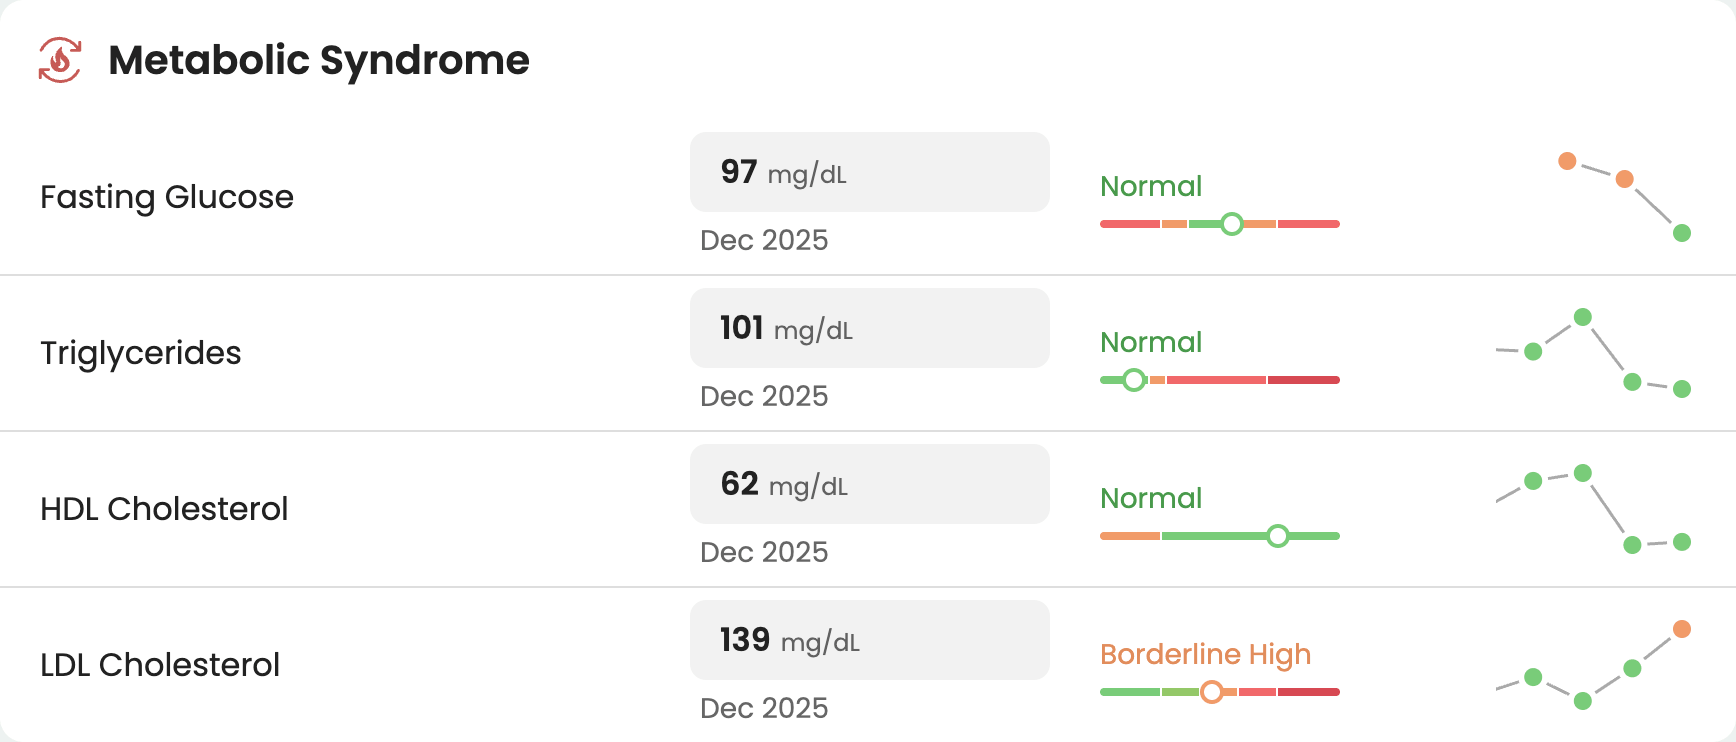
You can also create custom biomarker groups and panels to surface the labs most relevant to your practice. If you focus on metabolic health, hormones, or longevity, for example, you can build a panel that pulls those markers together in one view, without waiting for a default group to exist in the platform.
To set up biomarker groups or custom lab ranges and descriptions for your whole patient panel, go to Provider Home > Biomarker Settings. For individual patients, lab ranges and descriptions can be configured from the Biomarkers tab in their respective profiles using the Customize button.
Learn more about lab data unification in Guava →
Ask Guava AI
Guava AI is available to both providers and patients, and all conversations are fully HIPAA-compliant and secured within the platform.
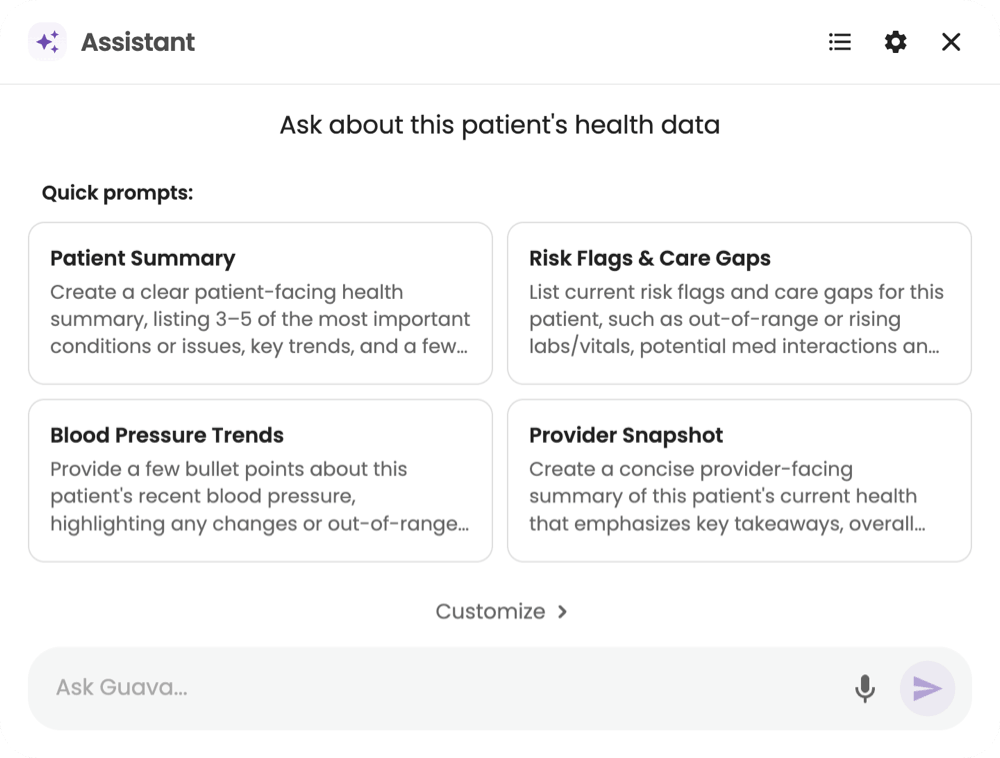
For providers, Guava AI lets you ask questions about a patient's health history and get answers grounded in their actual data. You can use it to surface trends, flag anomalies, or generate a quick summary before heading into an appointment, without manually digging through records. It's particularly useful for visit prep, giving you a clear picture of what's changed and what warrants follow-up.
Patients have access to their own version of the assistant in the Guava app. They can ask questions about their health data, prepare for upcoming appointments, and generate a Visit Prep PDF to bring to their provider. They can also use it to log symptoms, meals, or other health entries by voice or text.
Tip: Patients can ask the Guava AI how to use the app itself. It's a great way for them to get oriented and discover features on their own.
Read more about how you can use AI as a physician using Guava →
Health Scores
Custom Health Scores give you a live view of where your patients stand, individually and across your practice. Whether you're preparing for a visit, running a population review, or tracking progress on a specific protocol, scores give you a structured way to see who's on track and who needs follow-up.
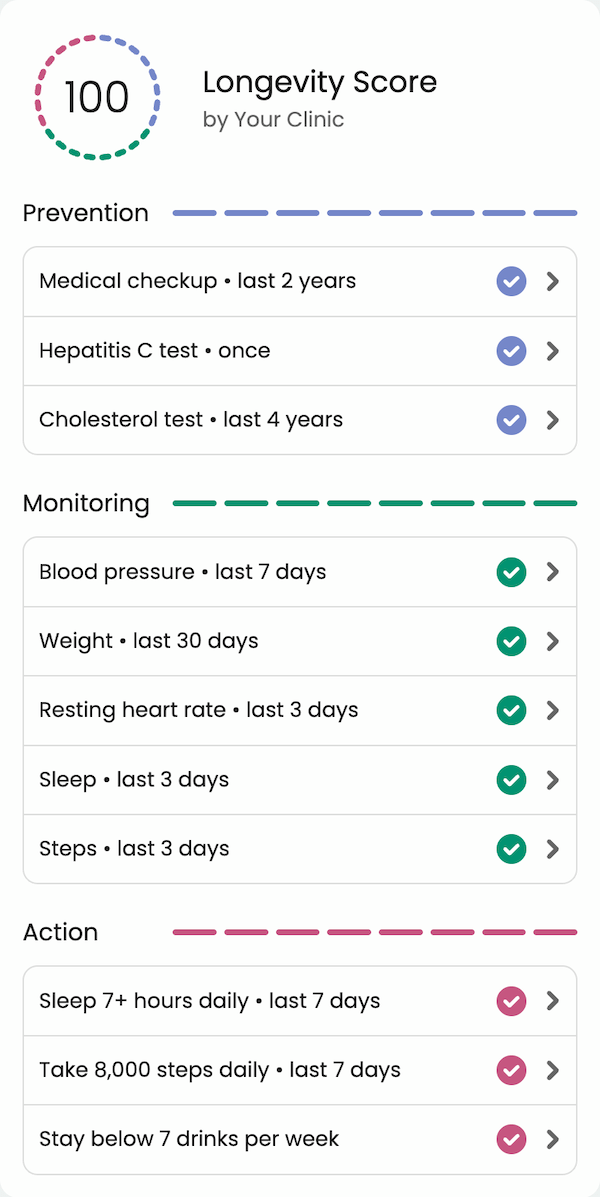
Each score is built around three areas: prevention, monitoring, and action. Prevention factors focus on proactive care, like annual recommendations based on a patient's age, sex, or risk profile. Monitoring factors track clinical markers over time, such as biomarker targets or vital sign thresholds. Action factors reflect behavioral goals the patient is actively working toward, like activity levels, nutrition targets, sleep, or stress management.
You can combine these however your care model calls for, and patient data is automatically filled out from their data in Guava. You can add a multi-cancer screening test to the prevention section, or create an entire cardiovascular-focused score pulling in blood pressure, cholesterol, and activity data. A metabolic health score might track fasting glucose, steps, and dietary habits. Scores can be adjusted over time as patient needs evolve, keeping them aligned with both short-term milestones and longer-term health objectives.
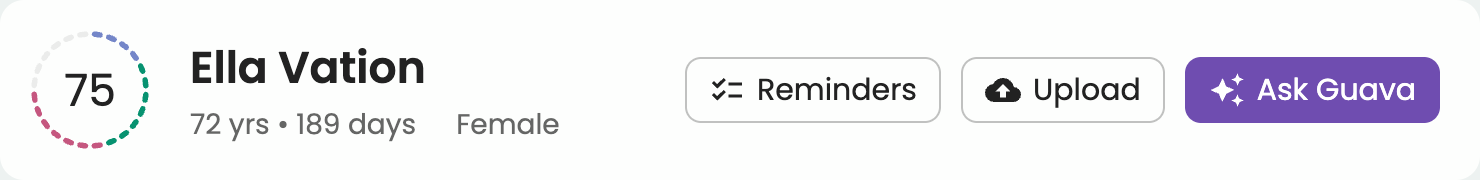
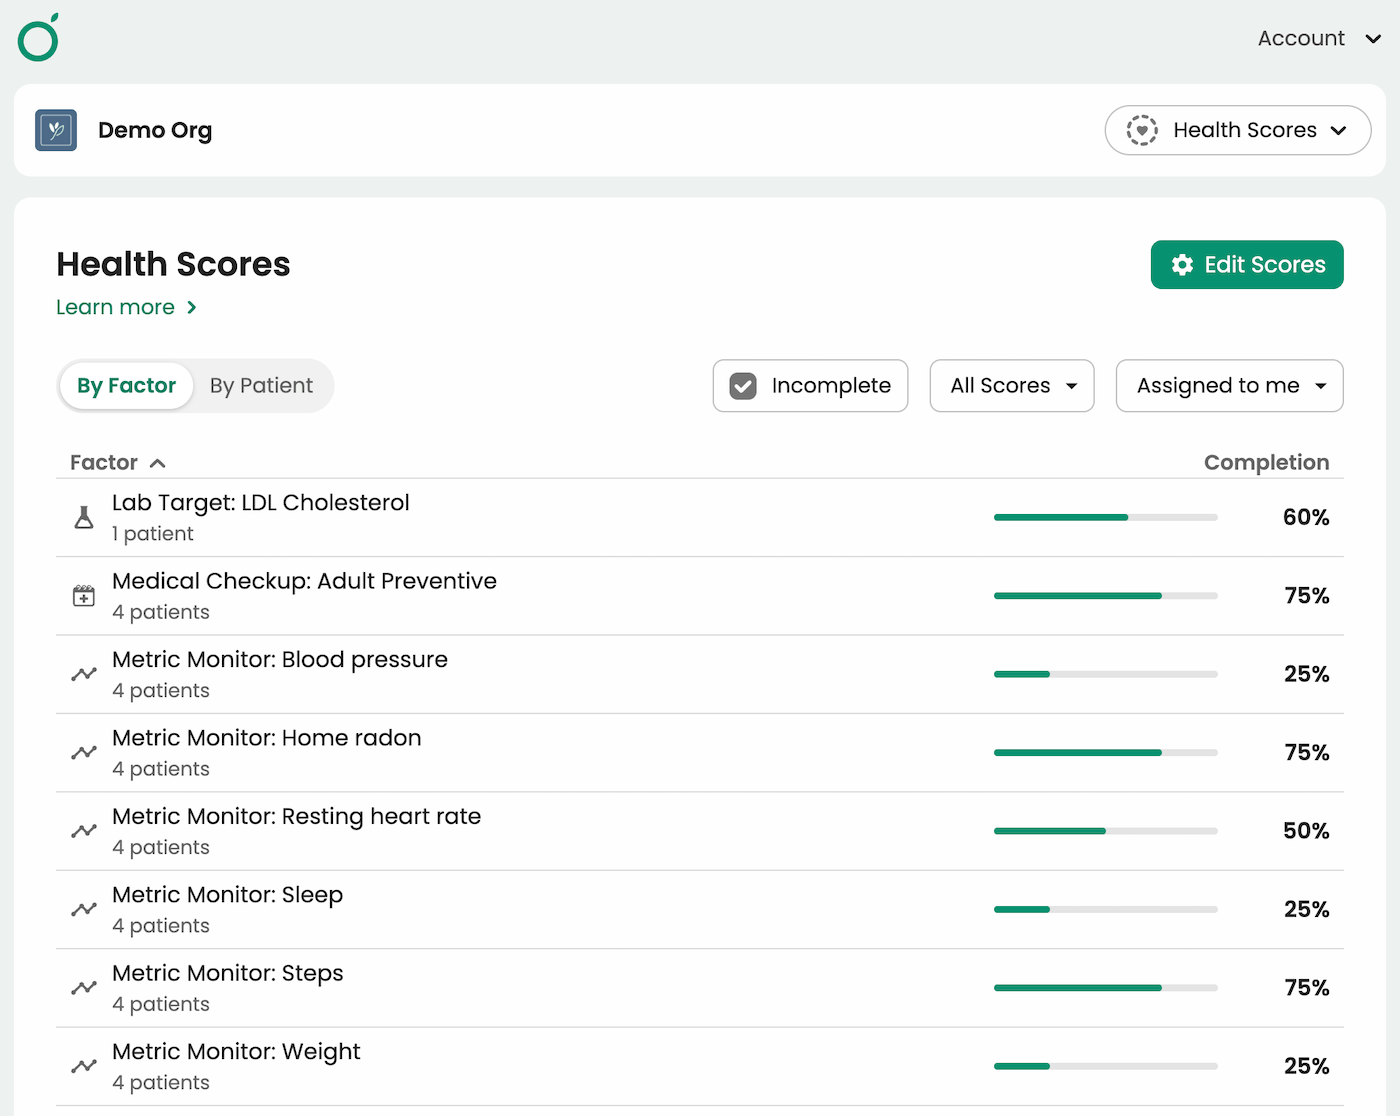
Health Scores appear next to each patient's name at the top of their profile. You can view them by patient or by factor.
- The by-factor view shows what percentage of your panel has completed or reached a given goal, making it easy to spot where follow-up is needed across the board.
- The by-patient view lets you zero in on an individual to assess their overall progress at a glance.
By default, all patients are assigned Guava’s Preventive Health Score, which is comprised of standardized guidelines from the world’s top health authorities, including the World Health Organization (WHO) and the US Centers for Disease Control and Prevention (CDC).
Creating a Custom Health Score
- Go to Provider Home > Health Scores > + New Score, or Provider Home > Health Scores > Edit > + New Score if you’ve already added a score in the past
- Name your score and add a description explaining the purpose, so patients understand what their score reflects
- Add relevant factors under Prevention, Monitoring, and Action
- Assign patients to your new score
Assigning Health Scores to Patients and Setting Defaults
- Go to Provider Home > Health Scores > Edit Scores and press the three dots next to your score
- Select Edit Assignments to assign the score to patients and optionally set it as their default score.
- Alternatively, assign or customize scores from within a patient's profile by clicking their Health Score in the Dashboard tab > Health Score Settings. To assign them a score, select Manage Organization Score. To customize their score, click into the factors you want to customize or press + Add to add a new factor.
Profile
In the Profile tab, you’ll find an overview of your patient's medical history, medications, conditions, allergies, vaccinations, and more. Data in the profile is automatically added from connected and uploaded records, and you and your patients can correct and add missing information as well.
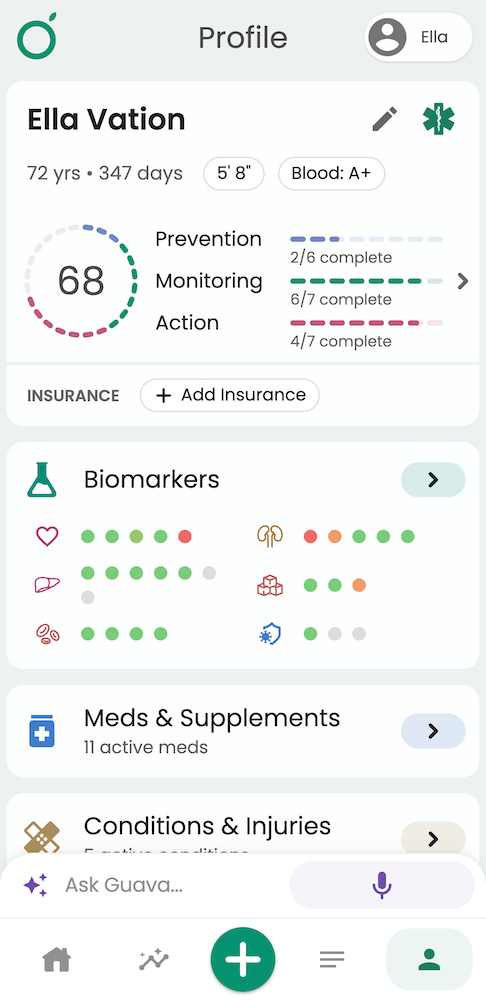
The Profile tab is where your patients can find Custom Health Scores you've created for them and Guava's Longevity Score. It's also where they can access their biomarkers, including any custom ranges, descriptions, and interpretations you've added.
Records
The Records tab is your central view of each patient's full medical history, pulled together from connected EHRs, file uploads, and manual entries. Patients can sync from over 100,000 EHRs, upload documents directly, or import labs and imaging. Guava automatically parses all incoming records into structured, searchable data so nothing gets buried.


Guava AI can answer questions grounded in a patient's full medical history, Health Scores draw on this data to populate automatically, and your Dashboard will flag new records as they come in.
Learn more about getting patient records into Guava →
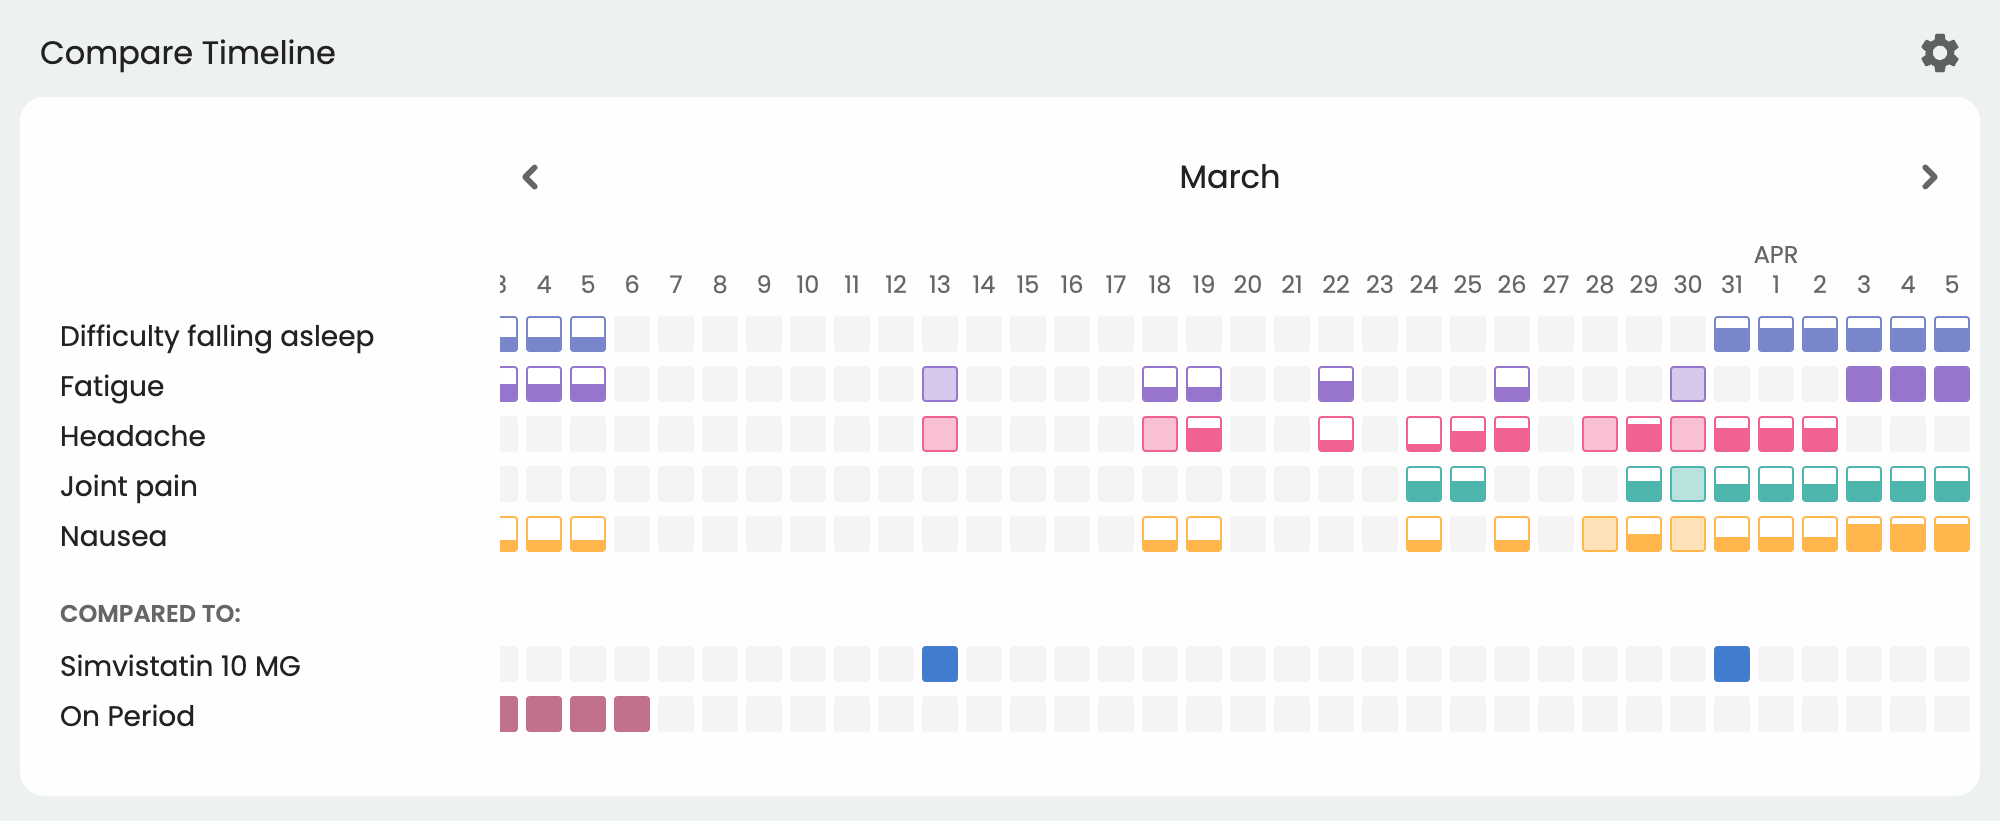
Compare Timeline
The Compare Timeline gives you a day-by-day view of specific health factors logged by your patient. It helps you identify key events surrounding symptom spikes, fluctuations in medication adherence, and visualize patterns that might be worth discussing.
4. Staying Connected Between Visits
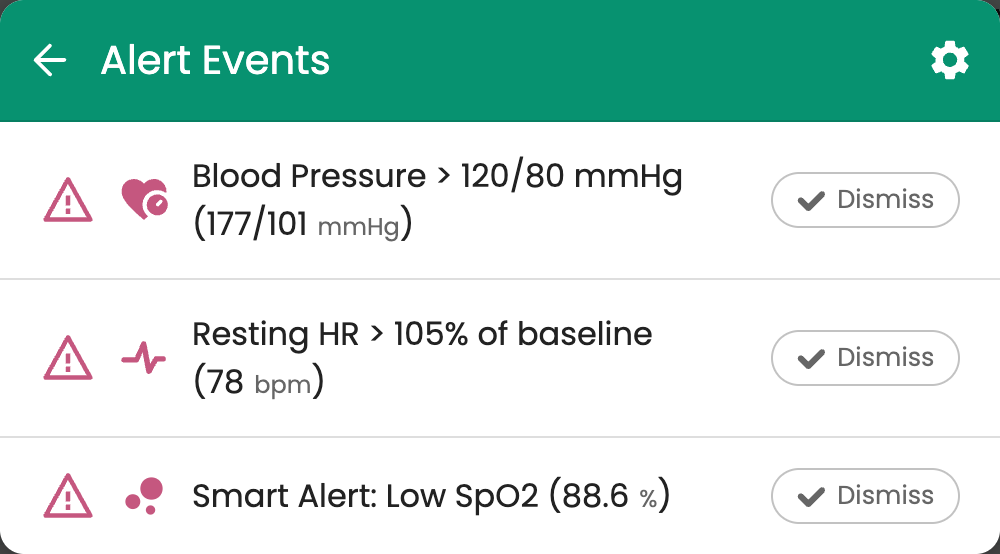
Alerts

Alerts are customizable indicators that notify you when your patient's health metrics cross thresholds you define. Once you set them up, they’ll appear at the top of your patient’s profile. Smart Alerts are also enabled by default and use AI to adjust your notifications based on your patients’ data, saving you time on manual reviews and mitigating alert fatigue.
Alert types can vary depending on your clinic’s specialty or your individual patient. For example, you might want to keep a close eye on your diabetic patient’s glucose levels or monitor the resting heart rate of your patient with orthostatic intolerance.
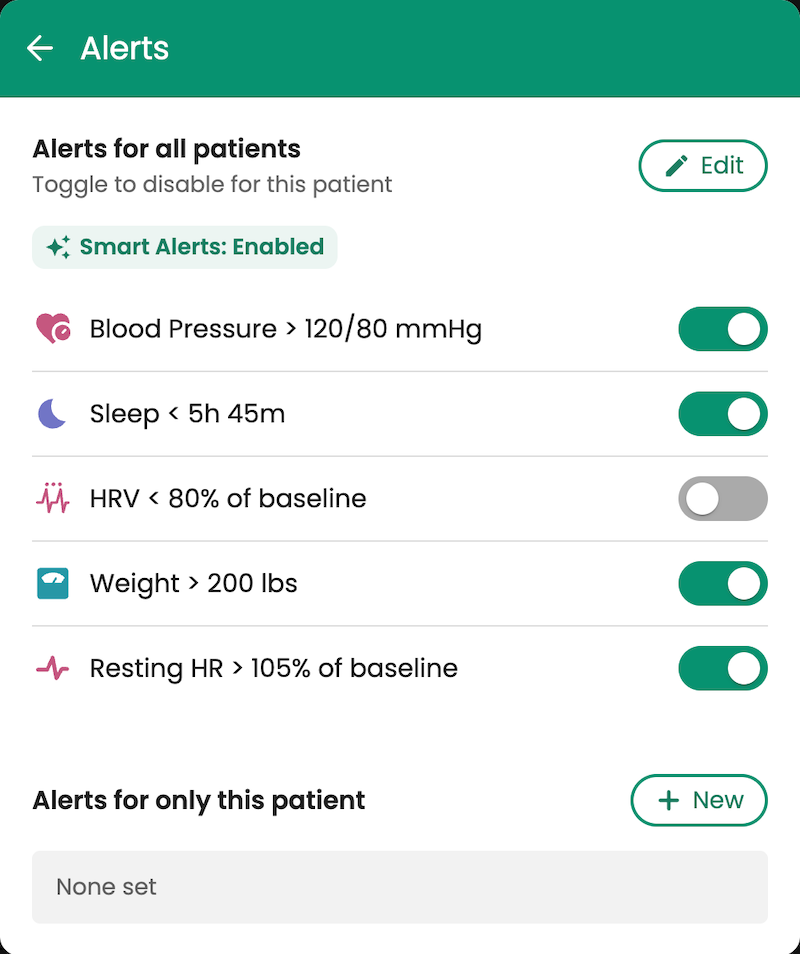
Setting Up Custom Alerts
For individual patients:
- Go to Alert Events at the top of their profile
- Select Settings > + New next to Alerts for only this patient
- Configure their alert
- Optionally toggle on/off any clinic-wide alerts
For clinic-wide alerts:
- Go to the Alerts tab on your Provider Home
- Select Edit Alerts > + New Alert
Configure your alert criteria:
- Metric: choose the health factor you want to monitor, like sleep, heart rate, or glucose
- Threshold: set either a percent of baseline or an absolute number, with a comparator (less than, greater than, etc.)
- Baseline period: choose the lookback window for calculating the patient's baseline (7, 14, 28, or 91 days)
- Alert sensitivity: specify how many times a value must be out of range before triggering an alert (once, twice, or 3 times)
- Alert frequency: set how often you can be alerted per patient (daily, weekly, or every 2 weeks)
- Notes: add any internal notes relevant to the alert
Messaging
Guava's messaging feature keeps communication between providers and patients secure, organized, and connected to their full clinical context in Guava. For clinics that choose to use Guava for messaging rather than relying on outside channels, everything stays within the platform. Messaging in Guava is fully HIPAA-compliant and tied to each patient's profile.
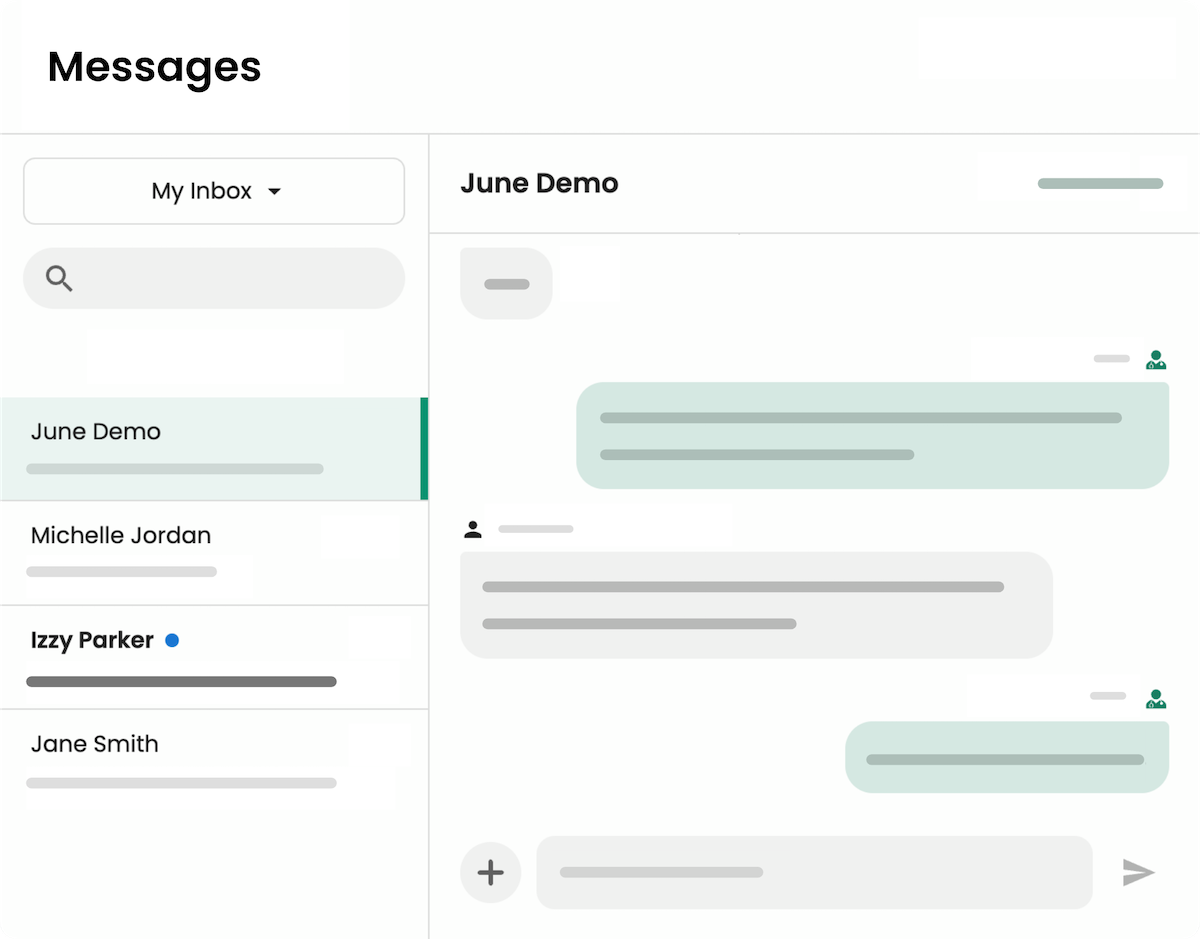
Providers can send messages directly to patients between visits, whether to follow up on a recent lab result, check in after a new symptom log, or share a quick note ahead of an appointment. File and image sharing is supported, so you can send documents, results, or visuals directly through the conversation without needing a separate channel. For patients, messaging means a direct line to their care team without the friction of phone tags or patient portal workarounds.
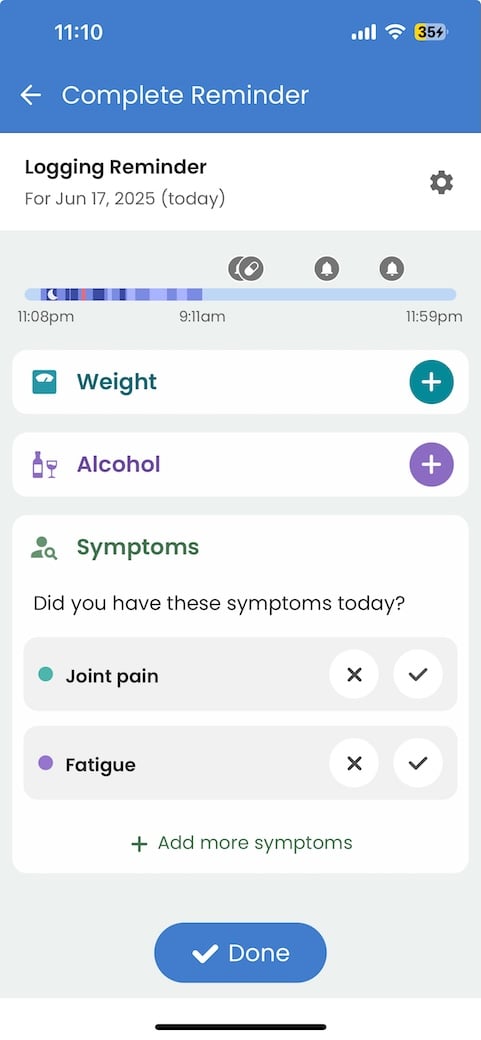
Daily Check-Ins
Daily check-in reminders help you stay on top of patient engagement without having to manually follow up. You can set recurring prompts for patients to log symptoms, nutrition, mood, and more, tailored by individual or set as a clinic-wide default. It's a simple way to keep patients consistent with their tracking, which means richer data and more productive visits on your end.

Learn more about setting daily check-ins for your patients →
5. The Patient Experience
Guava not only gives you a comprehensive view of your patients' health data, but it also gives your patients a genuinely high-quality experience of their own. The Guava app holds a 4.8 on the App Store and 4.9 on Google Play, reflecting how much patients value having their health information accessible, organized, and easy to understand. When you invite a patient to your dashboard, they receive a Premium account and everything that comes with it.
From the app, patients can:
- Access records from your clinic alongside data from external EHRs and health systems, all in one place
- Upload physical records and have them automatically parsed and organized by AI
- Sync wearable devices and third-party apps for insights across all their tracking
- Log symptoms, medications, mood, nutrition, and more
- Get automatic insights into relationships between their health factors over time
- Ask questions about their health data through Ask Guava AI, a secure, HIPAA-compliant assistant grounded in their full medical context
Connecting Patient Records and Wearable Devices
Patients can consolidate all their records in one place using Guava by connecting to their current and past patient portals and health systems. You and your patients can also upload physical documents, such as lab results and scans, which will be parsed and organized by Guava's AI record-reading technology. This gives both of you a complete view of their medical history in the Records tab, where lab results and scans are accessible as individual reports, with lab data also surfaced and tracked longitudinally in the Biomarkers section. Both are fully searchable and available as context for Ask Guava AI.
In addition, Guava offers direct integrations with Elation, Hint, Athena, Cerbo, Spruce, and InBody to automatically sync data into your patients’ profiles.
Read more about getting patient records into Guava →
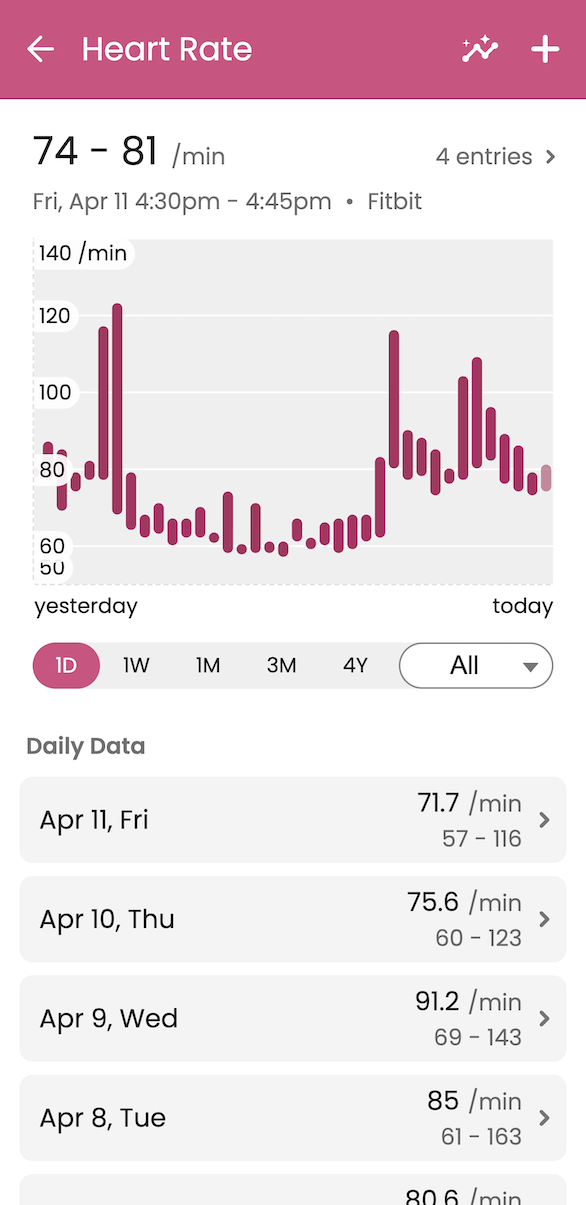
Patients can also sync with thousands of wearable devices and health apps so that you both can see a full picture of their health across activities, vitals, sleep data, and more.
To connect wearables, patients can go to the menu (their name in the top-right corner) >Data Sources > Devices & Apps. Device metrics can be viewed in the Home tab by patients and will appear in the Key Metrics section of the Dashboard tab for providers.
Browse all 100,000+ supported devices and health systems →
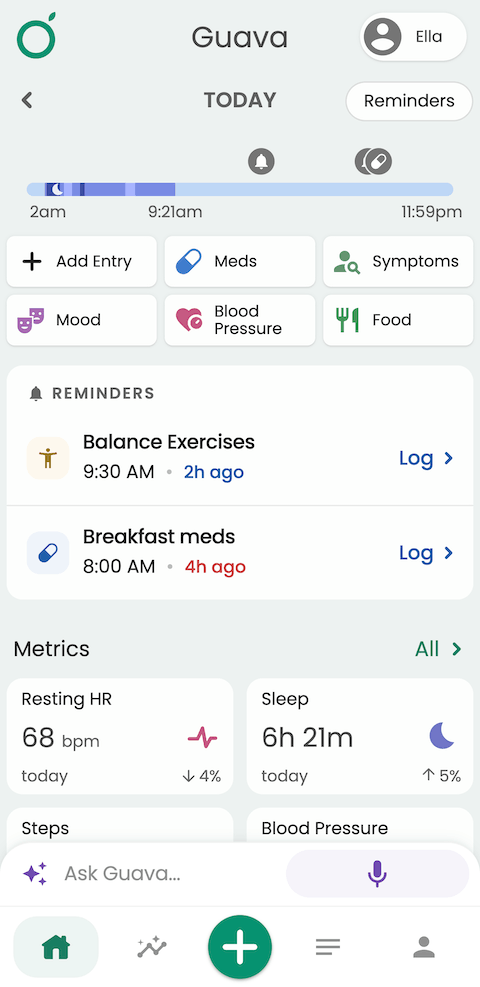
Viewing and Logging Health Metrics in the Home tab
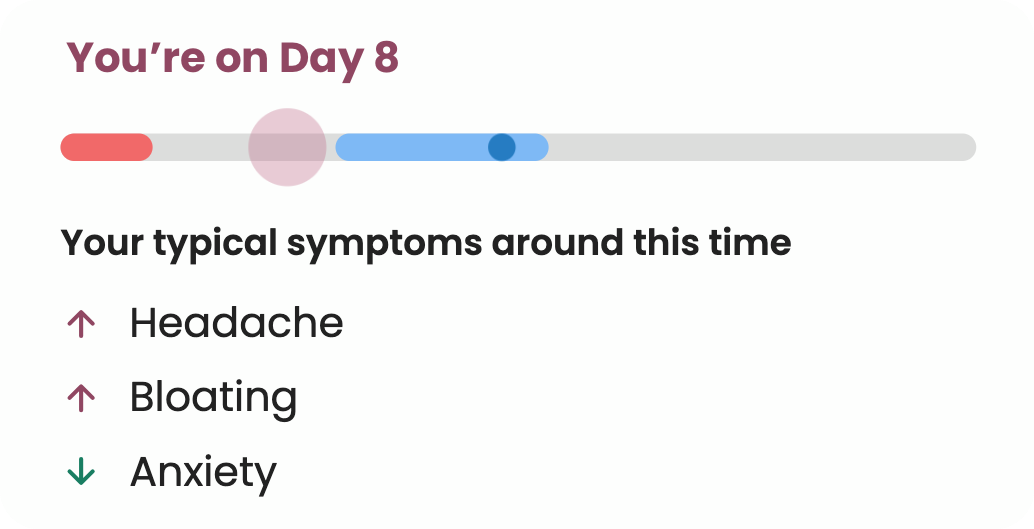
The Home tab provides patients with a snapshot of their health at a glance. They can view metrics synced from their wearable devices and connected apps, and log symptoms, medications, mood, cycle, nutrition, and more. Any check-in reminders you've set for them will also appear here for them to find and act on.
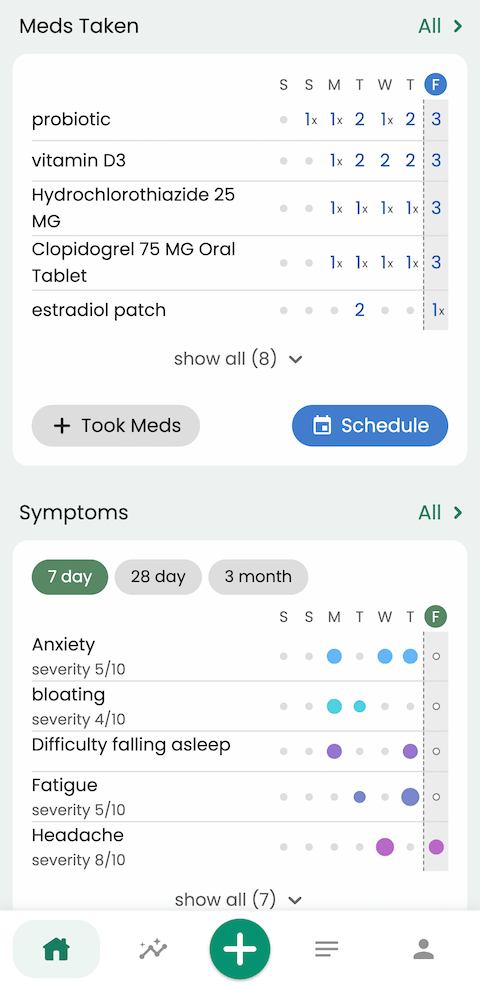
Learn more about tracking and visualizing symptoms in Guava →
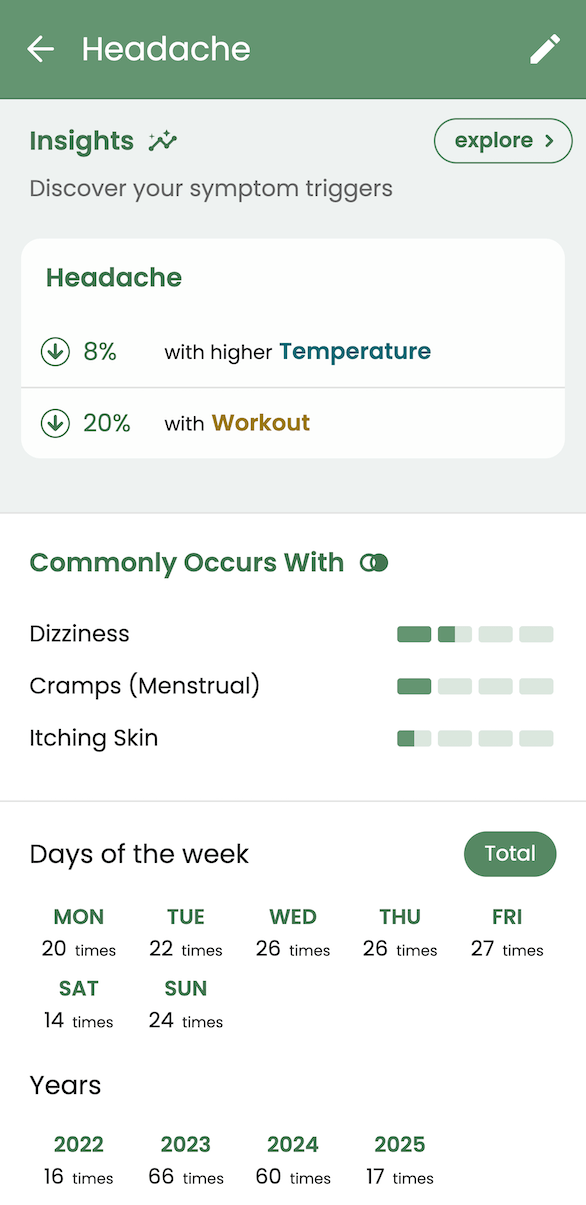
Health Correlations and Insights
The Insights tab surfaces statistically significant correlations between your patients' logged symptoms, medications, wearable data, and other health factors, helping you spot patterns that might otherwise go unnoticed across fragmented data sources.
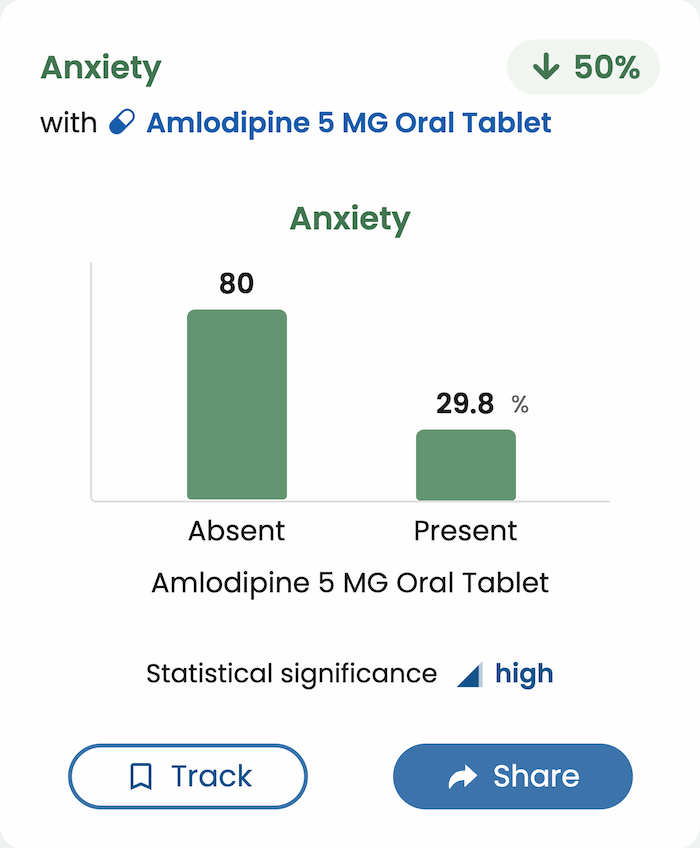
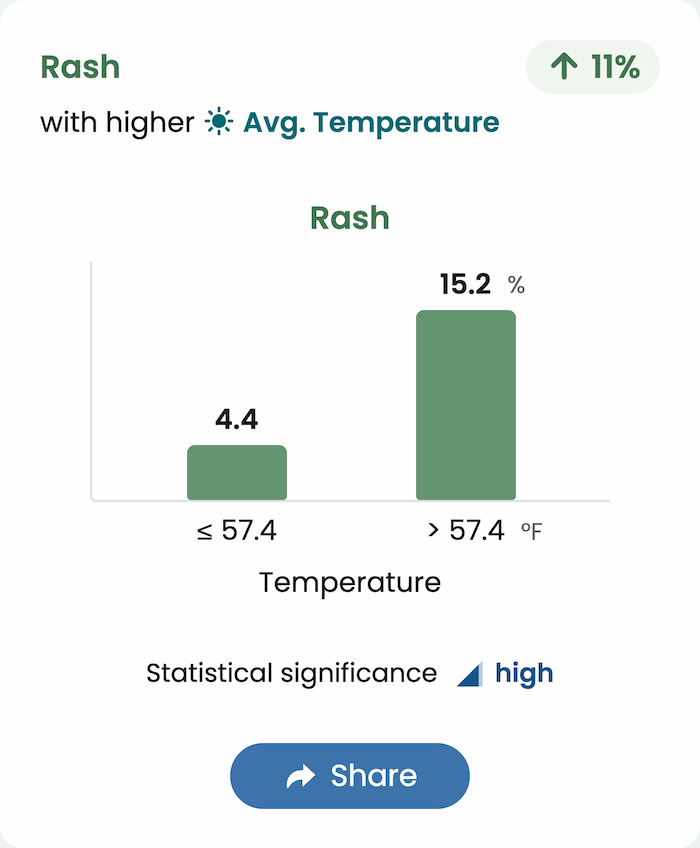
For example, a patient might notice that their HRV consistently dips on days following alcohol consumption, or that symptom flares tend to cluster around drops in a specific lab marker or cycle phase. Rather than surfacing a correlation alone, Guava lets you and your patient drill into the underlying data points driving it, so the insight is grounded in concrete, actionable data rather than just a trend line.
Patients can explore their own Insights in the app, making it a useful touchpoint for engagement between visits and a natural conversation starter when you're reviewing their progress together.
Inviting Patients and Team Members
Now that you're familiar with the Guava platform, the best next step is to invite your full patient panel.
The more patients who are active on the platform, the more useful it becomes during panel review and visit prep. When patients have had time to connect their records, sync their devices, and get comfortable with logging, that context is already in place when you need it. This also helps patients feel more engaged with your practice when they have a consistent touchpoint between visits.
Learn about the best practices for onboarding patients to Guava →
The value of Guava compounds as more of your patients are active on the platform, and getting everyone oriented early sets you up to get the most out of every feature. In this section, we’ll walk you through how to invite patients individually and in bulk via CSV import. If you have an EHR with a direct integration with Guava, you can also import all your patients in just a few clicks.
Inviting patients
Individual Patients
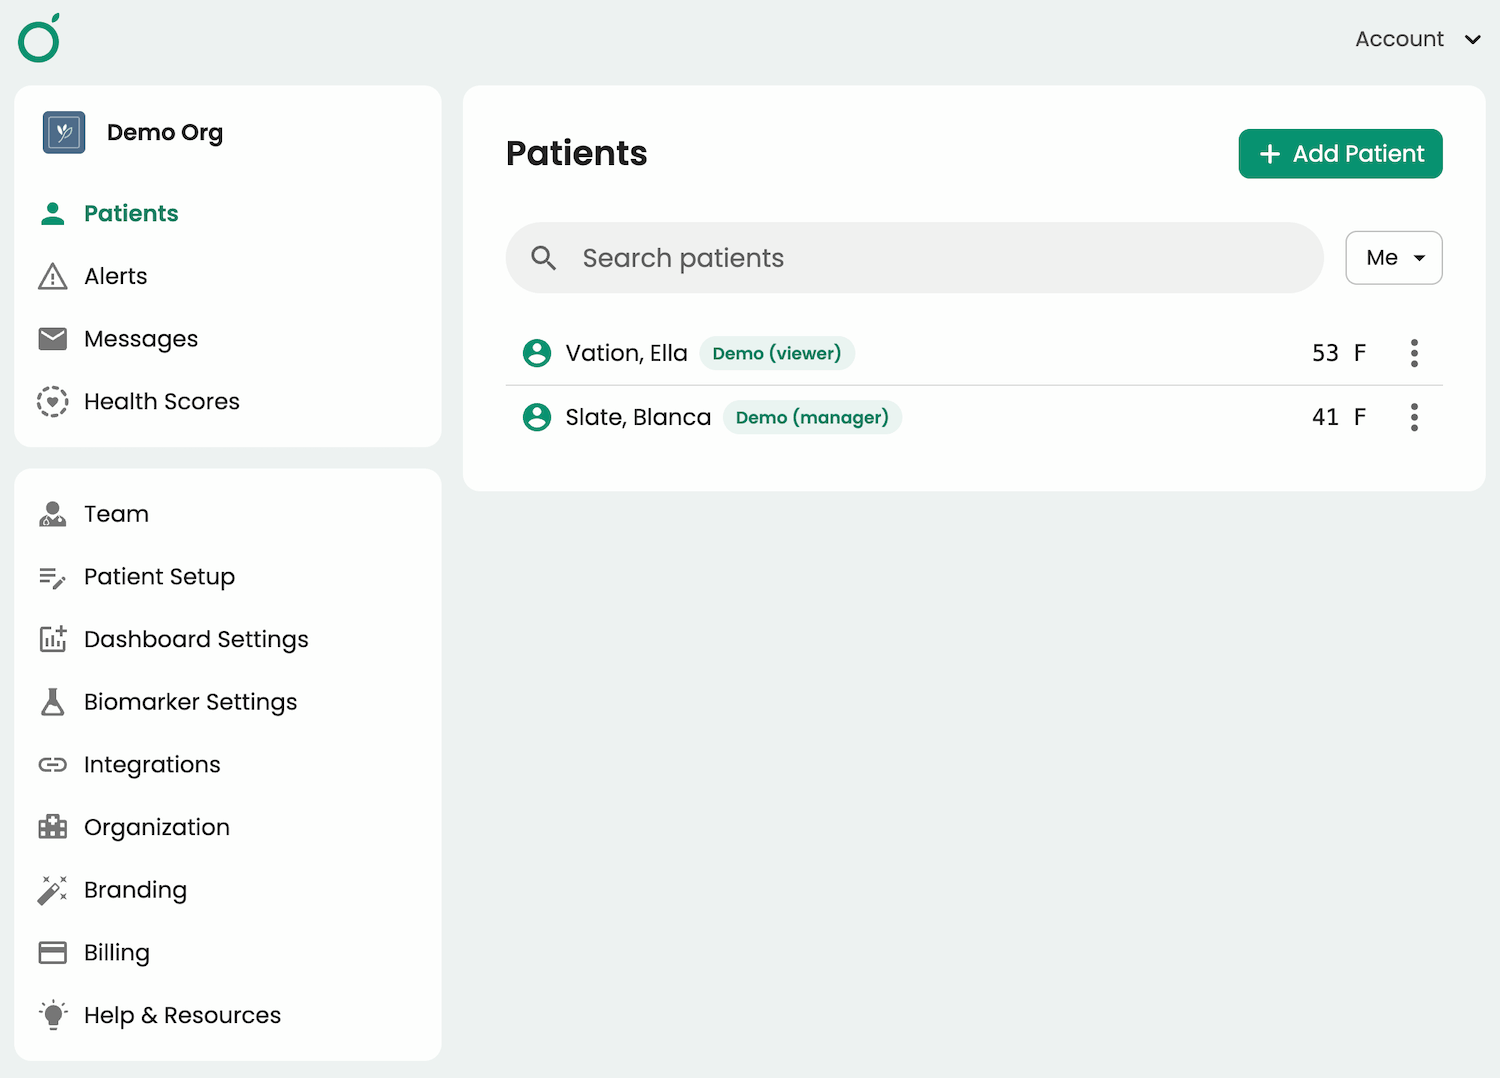
You can either invite your patient to create their own profile or you can create a profile for them. Creating it on their behalf lets you start adding records right away, which they’ll be able to view once they get Guava. To invite an individual patient to your Dashboard:
- Go to the Patients tab and click + Add Patient
- Enter their name and the email address they use with your practice
- Choose whether to invite them to create their own profile or create one on their behalf
- Optionally, request daily check-ins, choose between manager and viewer permissions, and assign team members responsible for their care
Bulk Patient Import via CSV
To invite a group of patients all at once:
- Go to + Add patient > Bulk CSV Import (in the top right corner).
- Choose between immediately inviting patients to create their profiles or importing your patient list and sending invites later. The latter allows you to add data on your patients’ behalf before they set up their account.
- Follow the instructions to ensure your CSV file is formatted correctly, including each patient’s first name, last name, email, and, optionally, an assigned team member.
- Upload your file, then make any necessary corrections to ensure each row’s information is properly aligned to the fields in Guava.
- Edit viewer/manager permissions for these patients before sending invites or creating profiles.
Once you import or invite your patients, they’ll appear under the Pending Invitations section of the Patient tab. For patients whose profile you’ve created but not yet invited, this section is where you can view their profile, add data, and eventually invite them. If you’ve already sent invites, this is where you can remind patients to accept them using the Remind All button or individually.
If your patients need help creating their Guava account, this guide walks them through setting up Guava through a provider.
If your patients need help creating their Guava account, this guide walks them through setting up Guava through a provider.
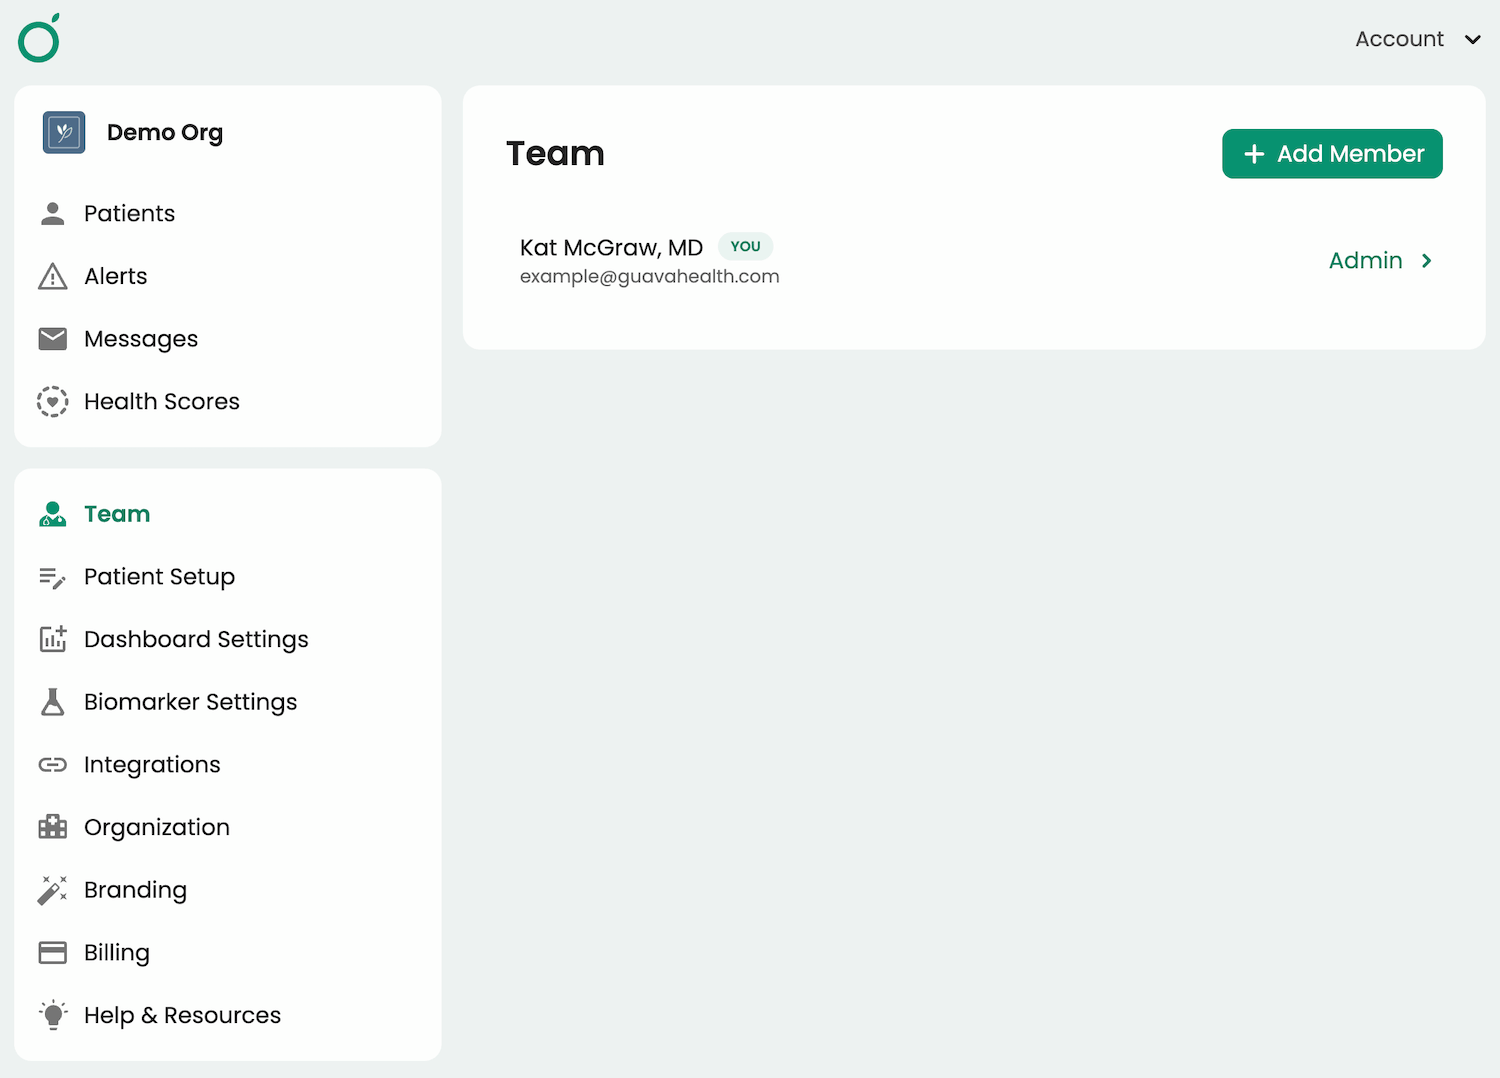
Inviting team members
To invite team members to your Provider Dashboard, head to the Team tab > Add Member. They can either be an admin (with permission to manage other team members’ profiles) or a member with standard access.
Privacy & security
Guava follows HIPAA, federal, and state laws and will only disclose user data if they or someone they give permission to explicitly shares their profile. Providers have access to this data only when a patient has consented to share this information. Read more about our privacy and security standards.
Ready to get started?
We built the Provider Dashboard to help you support your patients in a more connected, informed way, without adding more to your plate. Whether tracking progress, preparing for appointments, or monitoring ongoing care, Guava gives you the tools to see the whole picture.
Feel free to reach out to us with any questions at [email protected] or check out our Provider FAQ.